
- SAP Community
- Products and Technology
- Spend Management
- Spend Management Blogs by SAP
- Ariba Analytics using SAP Analytics Cloud, Data In...
Spend Management Blogs by SAP
Stay current on SAP Ariba for direct and indirect spend, SAP Fieldglass for workforce management, and SAP Concur for travel and expense with blog posts by SAP.
Turn on suggestions
Auto-suggest helps you quickly narrow down your search results by suggesting possible matches as you type.
Showing results for
Product and Topic Expert
Options
- Subscribe to RSS Feed
- Mark as New
- Mark as Read
- Bookmark
- Subscribe
- Printer Friendly Page
- Report Inappropriate Content
09-12-2022
9:40 AM
This is Part Three of a blog series on Ariba Analytics using SAP Analytics Cloud, Data Intelligence Cloud and HANA DocStore. If you would like to start with Part One, please click here
SAP Analytics Cloud makes it easy for businesses to understand their data through its stories, dashboards and analytical applications. Our worked example is using SAP Ariba Data to create an SAC Story that lets you know how much spend has been approved within Ariba Requisitions created in the last thirty days
In Part One of our blog series we discussed how we can retrieve data from SAP Ariba's APIs using SAP Data Intelligence Cloud. We stored this data as JSON Documents in the SAP HANA Document Store
In Part Two of our blog series we built SQL and Calculation Views on top of our JSON Document Collection
In this blog post we'll use the Calculation View in SAP Analytics Cloud as a Live Data Model, which will provide the data to our SAP Analytics Cloud Story
Before we can consume our Calculation View in SAP Analytics Cloud, we'll need to connect SAC to our HDI Container. We can do this from within SAC itself
Next, we'll have to enter the host and credentials for our HDI Container. If you're not sure where to find these, refer to Part One of this blog series where we retrieved these for Data Intelligence Cloud (under the heading Creating Our Connections in Data Intelligence)
Our HANA Cloud Connection has been created and now we're ready to create in SAC
Within SAP Analytics Cloud we're going to use a Live Data Model to access our Calculation View in real time. This means that the data in our Document Store Collection will be available immediately after our Data Intelligence Pipeline updates it
Another benefit of using this Live Data Model compared to creating a Model on Acquired Data is that data doesn't need to be copied to SAP Analytics Cloud for use
Now we're looking at the Live Data Model in the SAP Analytics Cloud Modeler. We can see our Calculated Measure, ReportingAmount
We can also check the Live Model's Dimensions
Now that we've got our Live Data Model, we're ready to create our Story and visualize our Ariba Data
Stories within SAP Analytics Cloud let us use visualize data in a number of ways, including charts, visualizations and images
Within a Story there are a number of different Page Types available. For our example we're going to add a Responsive Page. A Responsive Page allows you to create layouts that resize and adapt when viewed on different screen sizes
First we're going to give our Page a title - for example: Approved Requisitions (Past 30 Days)
Next, we're going to attach the Live Data Model we created to our Story
Now we're able to use the data from our Live Data Model in our Story
Now it's time to give our chart some data
Now we can see a sum of all of our Approved Requisitions. However, we may (or rather we probably will) have Requisitions in more than one currency. To separate these Requisitions we'll need to use Chart Filters
From here we'll be able to select which values of ReportingCurrency we'd like to see reflected in our ReportingAmount total. Given that it doesn't make sense to sum totals in different currencies without first converting them, we're going to select only a single currency
The data in your system may have different currencies than mine, so feel free to adjust accordingly
While it's great to have our total, the average end user is not going to know what ReportingAmount means. It's time to give our Numeric Point a meaningful label
At this point, we have our Numeric Point set up and ready to go
If your system only has the one currency, you can leave it here. If your system has more than one currency, you can duplicate the Numeric Point, then change the Chart Filter and Chart Title using the same steps we just followed
Once we've finished with our currencies, it's time to save
Our Story is now finished and ready to be viewed
Now we've created our Story, but we don't want it to just sit inside our Files on SAP Analytics Cloud - we want people to use it. Let's share our story with our colleagues
Now we've shared our Story with users, and decided what kind of access we'd like them to have. This isn't the only type of sharing available in SAP Analytics Cloud - for example you can learn about publishing to the Analytics Catalog here, and read about your other options in the Help Documentation
Now that our setup work is done and the users can view our SAP Analytics Cloud Story, we want to make sure the underlying data in our SAP HANA Document Store Collection is kept up to date on a regular basis
When we create our first Schedule, we'll see My Scheduler Status: Inactive. We don't need to worry - our Scheduler's Status is actually Active. To see it, we can click on Refresh
You may remember back in our first Blog Post that our Pipeline waits twenty seconds between each call of the Ariba APIs. This is because each of Ariba's APIs has rate limiting. These rate limits are cumulative
What that means for us is that for each Realm and API (for example MyCorp-Test Realm and Operational Reporting for Procurement - Synchronous API) we have a shared rate limit, no matter how it's called
The Pipeline we provided in Part One of this blog series is optimized for performance - i.e. it makes calls as fast as Ariba's rate limiting will allow
If there's more than one instance of this Pipeline running at once, both will receive a rate limit error and no data will be uploaded to our Document Store Collections
Please keep this in mind when you plan for the scheduling of these pipelines, and refer to the Ariba API Documentation for up-to-date information on Ariba Rate Limits as well as how many Records are returned each time the API is called
Throughout this blog series we've shown how we can set up a pipeline that will get data from Ariba and persist it in HANA Cloud Document Store, as well as how we can schedule it to run periodically
We've also shown how we can create a Calculation View on top of these JSON Documents, and finally how we can create a Story in SAP Analytics Cloud that will let us visualise our Ariba Data
The data and models in these blog posts have been rather simple by design, in a productive scenario we will likely want much more complex combinations and views. Hopefully having followed along with our worked example you'll have a good foundation to start with when you build your own
SAP Analytics Cloud | Introduction to SAP Analytics Cloud
SAP Analytics Cloud | Models Based on Live Data Connection to HANA Views
SAP Analytics Cloud | Sharing, Collaborating and Exporting
SAP Data Intelligence | Schedule Graph Executions
This blog series has had a lot of input from my colleagues – any errors are mine not theirs. In particular, thanks go to the Cross Product Management – SAP HANA Database & Analytics team, Antonio Maradiaga, Bengt Mertens, Andrei Tipoe, Melanie de Wit and Shabana Samsudheen
Note: While I am an employee of SAP, any views/thoughts are my own, and do not necessarily reflect those of my employer
Recap
SAP Analytics Cloud makes it easy for businesses to understand their data through its stories, dashboards and analytical applications. Our worked example is using SAP Ariba Data to create an SAC Story that lets you know how much spend has been approved within Ariba Requisitions created in the last thirty days

A simple SAC Story tracking Approved Requisitions
In Part One of our blog series we discussed how we can retrieve data from SAP Ariba's APIs using SAP Data Intelligence Cloud. We stored this data as JSON Documents in the SAP HANA Document Store
In Part Two of our blog series we built SQL and Calculation Views on top of our JSON Document Collection
In this blog post we'll use the Calculation View in SAP Analytics Cloud as a Live Data Model, which will provide the data to our SAP Analytics Cloud Story

Viewing our HANA DocStore Collection data in an SAP Analytics Cloud Story
Accessing our HDI Container from SAP Analytics Cloud
Before we can consume our Calculation View in SAP Analytics Cloud, we'll need to connect SAC to our HDI Container. We can do this from within SAC itself

Click on Connections

Click on Add Connection

Select SAP HANA under Connect to Live Data
Next, we'll have to enter the host and credentials for our HDI Container. If you're not sure where to find these, refer to Part One of this blog series where we retrieved these for Data Intelligence Cloud (under the heading Creating Our Connections in Data Intelligence)
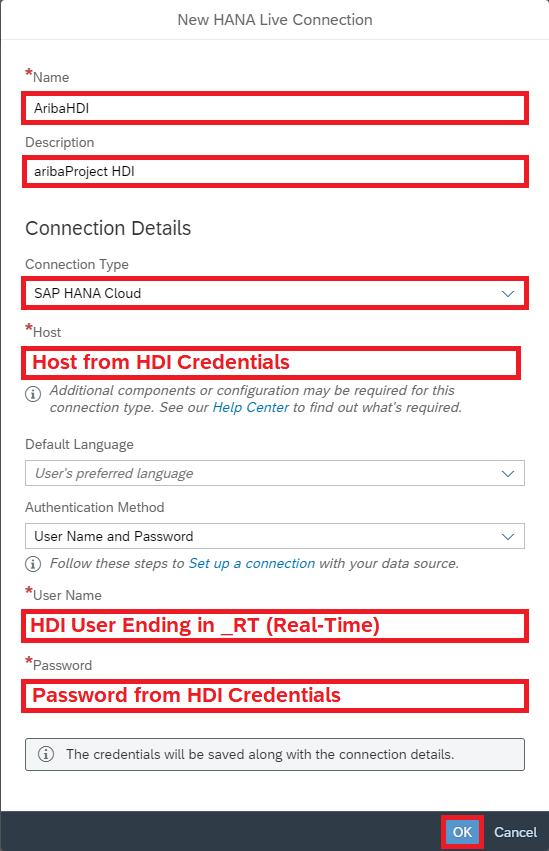
Choose HANA Cloud as the Connection Type, enter HDI details then click OK
Our HANA Cloud Connection has been created and now we're ready to create in SAC
Creating a Live Data Model
Within SAP Analytics Cloud we're going to use a Live Data Model to access our Calculation View in real time. This means that the data in our Document Store Collection will be available immediately after our Data Intelligence Pipeline updates it
Another benefit of using this Live Data Model compared to creating a Model on Acquired Data is that data doesn't need to be copied to SAP Analytics Cloud for use

Click on Modeler, then Live Data Model

Select SAP HANA as the System Type, our AribaHDI Connection then click on the Input Help for Data Source

Click on our Calculation View

Click OK
Now we're looking at the Live Data Model in the SAP Analytics Cloud Modeler. We can see our Calculated Measure, ReportingAmount

Viewing the Measures for our Live Model
We can also check the Live Model's Dimensions

Click on All Dimensions
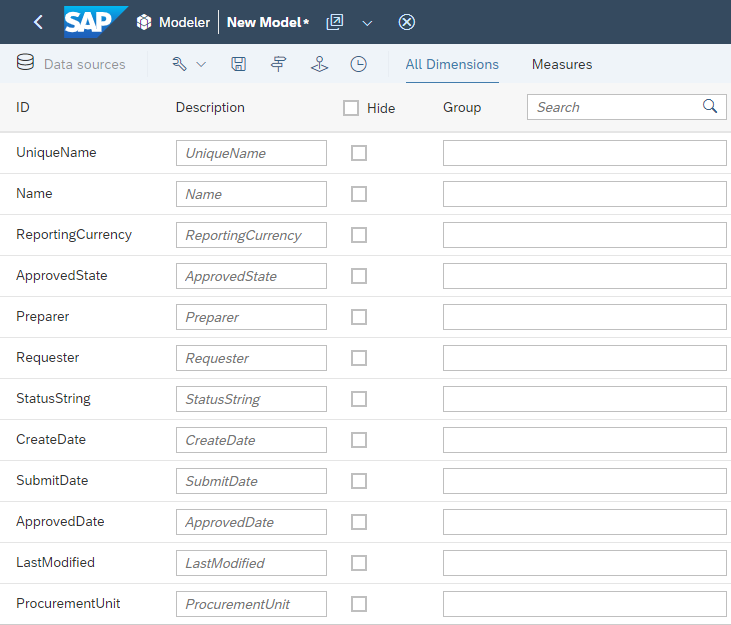
Our Dimensions are all here

Click on Save

Enter a Name and Description then click Save
Now that we've got our Live Data Model, we're ready to create our Story and visualize our Ariba Data
Creating an SAC Story
Stories within SAP Analytics Cloud let us use visualize data in a number of ways, including charts, visualizations and images

Click on Stories
Within a Story there are a number of different Page Types available. For our example we're going to add a Responsive Page. A Responsive Page allows you to create layouts that resize and adapt when viewed on different screen sizes

Click on Responsive Page

Leave Optimized Design Experience selected and click Create
First we're going to give our Page a title - for example: Approved Requisitions (Past 30 Days)

Double Click then give your Page a title
Next, we're going to attach the Live Data Model we created to our Story

Click on Add New Data

Click on Data from an existing dataset or model

Click on Select other model

Click on our Live Data Model
Now we're able to use the data from our Live Data Model in our Story

Click on Chart in the Insert Toolbar

Click on our Chart, then on the Chart Type dropdown and select the Numeric Point
Now it's time to give our chart some data

Click on Add Measure under Primary Values

Click the checkbox next to ReportingAmount
Now we can see a sum of all of our Approved Requisitions. However, we may (or rather we probably will) have Requisitions in more than one currency. To separate these Requisitions we'll need to use Chart Filters

Click on our Numeric Point again to exit the Measure Selection
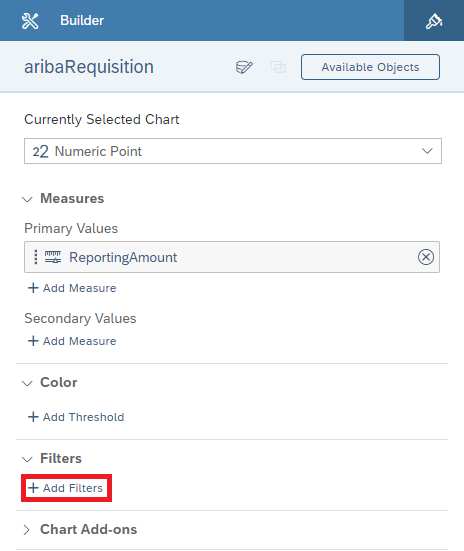
Click on Add Filters

Select the Column ReportingCurrency
From here we'll be able to select which values of ReportingCurrency we'd like to see reflected in our ReportingAmount total. Given that it doesn't make sense to sum totals in different currencies without first converting them, we're going to select only a single currency
The data in your system may have different currencies than mine, so feel free to adjust accordingly

Select your currency, unselect Allow viewer to modify selections and click OK

We now have our total ReportingAmount for our first currency
While it's great to have our total, the average end user is not going to know what ReportingAmount means. It's time to give our Numeric Point a meaningful label
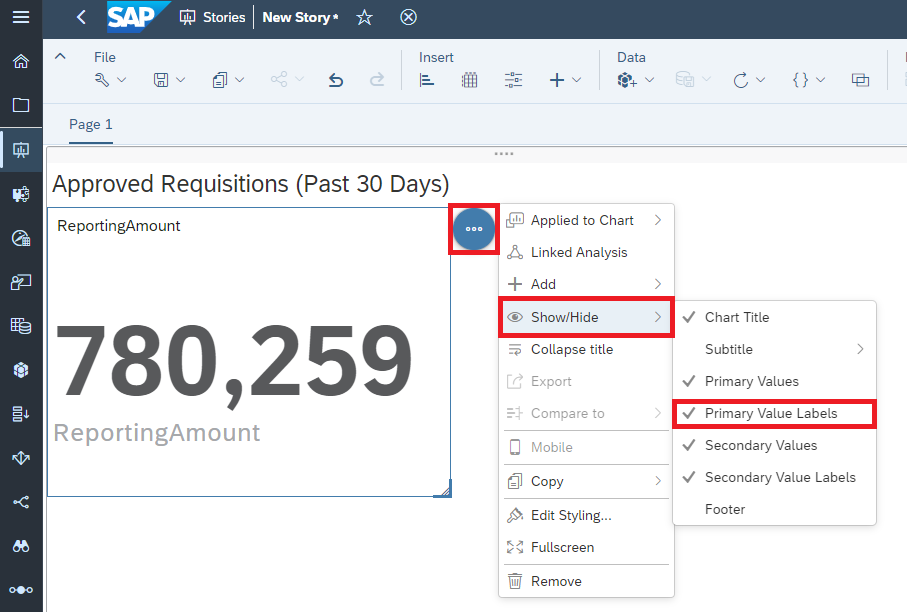
Click on Primary Value Labels under Show/Hide to turn off the lower ReportingAmount label

Double click on the Chart Title to edit

Type your Chart Title and use the Styling panel as desired

We can adjust the size of our Chart using the arrow in the corner
At this point, we have our Numeric Point set up and ready to go

Our finished Numeric Point
If your system only has the one currency, you can leave it here. If your system has more than one currency, you can duplicate the Numeric Point, then change the Chart Filter and Chart Title using the same steps we just followed
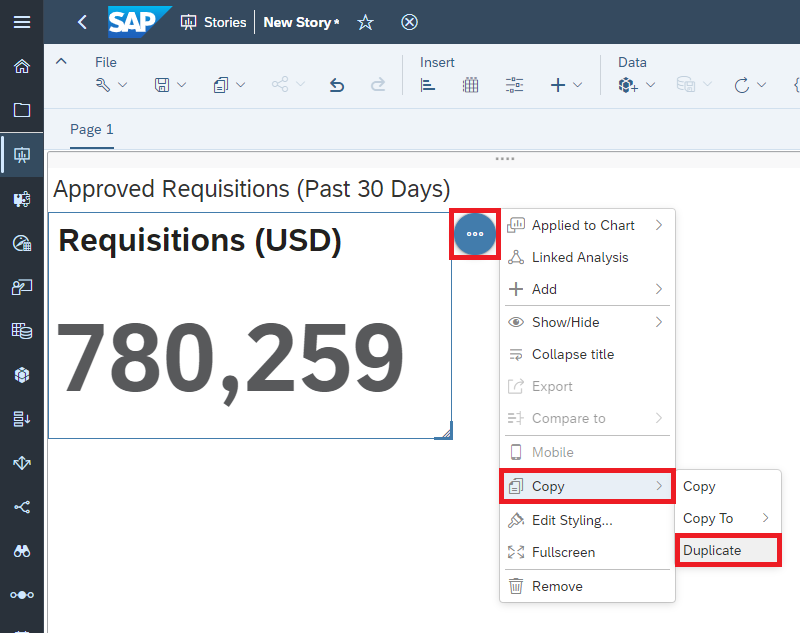
Click on Copy, then click Duplicate
Once we've finished with our currencies, it's time to save

Click on Save

Enter a Name and Description then click on OK
Our Story is now finished and ready to be viewed
Sharing our SAP Analytics Cloud Story
Now we've created our Story, but we don't want it to just sit inside our Files on SAP Analytics Cloud - we want people to use it. Let's share our story with our colleagues

Click on Files

Click on the checkbox next to our Story, then click on Share under the Share menu

Click on Add Users or Teams

Select users you'd like to share the Story with then click OK

Click the checkbox to notify the users by email, then click Share

If we'd like to change the Access Type, we can do that here
Now we've shared our Story with users, and decided what kind of access we'd like them to have. This isn't the only type of sharing available in SAP Analytics Cloud - for example you can learn about publishing to the Analytics Catalog here, and read about your other options in the Help Documentation

The Analytics Catalog is a single access point for SAP Analytics Cloud content vetted by your own Content Creators
Scheduling the Data Intelligence Pipeline
Now that our setup work is done and the users can view our SAP Analytics Cloud Story, we want to make sure the underlying data in our SAP HANA Document Store Collection is kept up to date on a regular basis
Since our SAP Data Intelligence Pipeline is responsible for truncating the data and supplying a new batch of data, we want to schedule it to run automatically. We can do this from Data Intelligence Cloud itself

Click on Monitoring

Click on Create Schedule

Write a description for our Schedule then choose our Pipeline under Graph Name
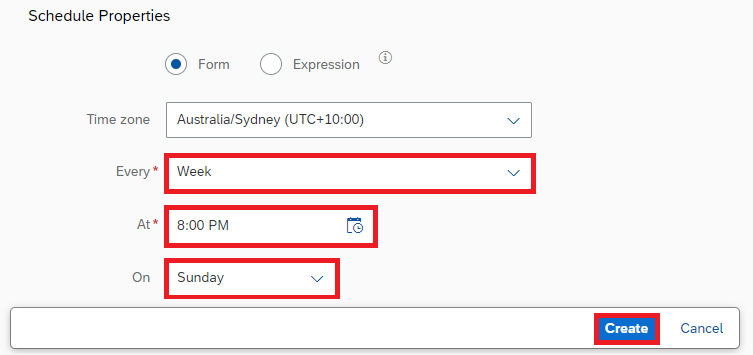
Choose how often our Pipeline will be run

Our Schedule has been created
When we create our first Schedule, we'll see My Scheduler Status: Inactive. We don't need to worry - our Scheduler's Status is actually Active. To see it, we can click on Refresh

Click Refresh

Our Scheduler Status is Active
An Important Note on Scheduling Ariba APIs
You may remember back in our first Blog Post that our Pipeline waits twenty seconds between each call of the Ariba APIs. This is because each of Ariba's APIs has rate limiting. These rate limits are cumulative
What that means for us is that for each Realm and API (for example MyCorp-Test Realm and Operational Reporting for Procurement - Synchronous API) we have a shared rate limit, no matter how it's called
The Pipeline we provided in Part One of this blog series is optimized for performance - i.e. it makes calls as fast as Ariba's rate limiting will allow
If there's more than one instance of this Pipeline running at once, both will receive a rate limit error and no data will be uploaded to our Document Store Collections
Please keep this in mind when you plan for the scheduling of these pipelines, and refer to the Ariba API Documentation for up-to-date information on Ariba Rate Limits as well as how many Records are returned each time the API is called
Wrap-Up
Throughout this blog series we've shown how we can set up a pipeline that will get data from Ariba and persist it in HANA Cloud Document Store, as well as how we can schedule it to run periodically
We've also shown how we can create a Calculation View on top of these JSON Documents, and finally how we can create a Story in SAP Analytics Cloud that will let us visualise our Ariba Data
The data and models in these blog posts have been rather simple by design, in a productive scenario we will likely want much more complex combinations and views. Hopefully having followed along with our worked example you'll have a good foundation to start with when you build your own
Other Resources
SAP Analytics Cloud | Introduction to SAP Analytics Cloud
SAP Analytics Cloud | Models Based on Live Data Connection to HANA Views
SAP Analytics Cloud | Sharing, Collaborating and Exporting
SAP Data Intelligence | Schedule Graph Executions
Special Thanks
This blog series has had a lot of input from my colleagues – any errors are mine not theirs. In particular, thanks go to the Cross Product Management – SAP HANA Database & Analytics team, Antonio Maradiaga, Bengt Mertens, Andrei Tipoe, Melanie de Wit and Shabana Samsudheen
Note: While I am an employee of SAP, any views/thoughts are my own, and do not necessarily reflect those of my employer
Labels:
You must be a registered user to add a comment. If you've already registered, sign in. Otherwise, register and sign in.
Labels in this area
-
Business Trends
113 -
Business Trends
12 -
Event Information
44 -
Event Information
3 -
Expert Insights
18 -
Expert Insights
25 -
Life at SAP
32 -
Product Updates
253 -
Product Updates
27 -
Technology Updates
82 -
Technology Updates
14
Related Content
- Mastering Procurement Analytics: Essential Strategies and Safeguards for Success in Spend Management Blogs by SAP
- The Procurement Monthly - March 2024 in Spend Management Blogs by SAP
- Navigating the Data-Driven World of Procurement Analytics: The Roadmap to Achieving Best-In-Class St in Spend Management Blogs by SAP
- Boosting Business Success with Procurement Analytics: A Journey Paved with Numbers in Spend Management Blogs by SAP
- SAP Analytics for Cloud and SAP Ariba - Data Connections in Spend Management Q&A
Top kudoed authors
| User | Count |
|---|---|
| 2 | |
| 1 | |
| 1 | |
| 1 | |
| 1 | |
| 1 | |
| 1 | |
| 1 | |
| 1 | |
| 1 |