

- SAP Community
- Products and Technology
- Human Capital Management
- HCM Blogs by Members
- A Deep Dive into Tacking New Hires and Leavers Tre...
Human Capital Management Blogs by Members
Gain valuable knowledge and tips on SAP SuccessFactors and human capital management from member blog posts. Share your HCM insights with a post of your own.
Turn on suggestions
Auto-suggest helps you quickly narrow down your search results by suggesting possible matches as you type.
Showing results for
bellakong
Participant
Options
- Subscribe to RSS Feed
- Mark as New
- Mark as Read
- Bookmark
- Subscribe
- Printer Friendly Page
- Report Inappropriate Content
12-18-2023
9:08 PM
Embark on a journey that transforms your SuccessFactors reporting experience. As mentioned, in this installment of our technical blog series, we unveil the keys to mastering Trend Analysis by using story report. Designed to empower HR professionals transitioning from legacy tools to the dynamic realm of SuccessFactors Story Reports, this blog unlocks the door to an insightful workforce analytics. In this edition, we'll explore a rolling back report focused on New Hires and Leavers, offering a practical example of the powerful capabilities Story Reports bring to your fingertips. Are you ready to redefine your approach to HR reporting? Let's dive into the art of reporting.
Prior to embarking on the steps outlined in this blog, it's essential to ensure that you've established the month start and end dates in your query. If you haven't done so yet, refer to the previous blog:
Creating Month Start and End Dates for Headcount Follow-Up in Story Reports. These dates are not just prerequisites; they are the bedrock of our trend analysis.
In this illustrative example, we've crafted backdated month start and end dates, aligning with the purpose of reporting historical data. It's noteworthy to mention that if your analysis focuses on future reporting, the logic remains consistent. Simply replace "-1" with "+1" in the formula, and the results will seamlessly display the month start and end dates in the future.
Before diving into the calculations, carefully review the hire date and end of employment date available in your system. These dates are pivotal for defining new hires and leavers in your workforce analytics. However, it's important to note that your system environment might present variations, especially in cases of rehires or different termination events.
In Employment details, you may encounter multiple dates associated with new hires (in instances of rehires) or termination events (such as last working date or termination date). Take a comprehensive look at the available dates and designate one as the definitive hire date and another as the end of employment date.
For the purposes of this blog, we'll be utilizing the hire date and end of employment date in our calculations.
New hires in last 1 month:
It's crucial to recognize that global assignments constitute a unique scenario. In the context of employees' host profiles, the hire date is not necessarily align with the date of their employment start within the organization. Consequently, host profiles are not considered new hires in the example provided. Don't worry, global assignment employees have HOME profile and the dates will be taken into consideration as normal. So they are not counted twice nor counted incorrectly as a new hire or a leaver.
Note: The terms "[Last month 1st date]" and "[last month end date]" are placeholders, and their actual names may vary based on the specific calculated column IDs you've created. When formulating the formula, the system will automatically display available tokens for your convenience.
With this understanding in place, let's apply the same logic to generate the remaining five calculated columns for new hires, extending from the last two months to the last six months.
Leavers in last 1 month:
If there has been no termination action done in the system, the end of employment date for an employee is empty (Null), and empty value will always lead to errors in calculation.
Therefore, we have to give a date value for those employees who have no end of employment date by creating a calculated column named as "Termination Date" in the example.
Here is a preview of the results of this column:
Once those dates are ready, let's count the employees who left the organization in last 1 month:
Again, employees who have been back from a global assignment will have an end of employment date or termination date on their HOST profile, and we need to exclude the count on HOST profiles because the dates indicate only the period of the global assignment.
Continue to complete the rest calculations for the other five months.
Reminder: be aware of the technical limitation in the query: 30 data tables and 120 columns.
Save your query at this point before continue.
3. Table List Validation
To guarantee the accuracy of your calculated columns or investigate possible errors, it's imperative to perform a thorough validation using a table list in Story Reports.
If you're new to creating a table list report or seeking additional tips, refer to this insightful blog: Creating Table Lists and Cross-Tab Tables in SAP SuccessFactors Story Reports
Validating your calculations through a table list not only enhances precision but also provides a visual confirmation of the data utilized in your Story Reports. It is recommended to export the list and cross check in Excel. This step is integral to building robust and dependable workforce analytics.
Example of exported list:
In the screenshot below, you can find part of the Columns used in the Builder for the list report.
4. Create a Canvas page for analysis visualizations
Build a Canvas Page in Story Reports and add necessary visualizations.
- Showcase monthly trends, year-to-date summaries, and any other relevant analyses.
To master the art of crafting compelling wage visuals, explore SAP's comprehensive materials. Whether you're delving into charts, numerical displays, heatmaps, or other formats, SAP provides the resources you need. Elevate your presentation game with the tools and insights offered by SAP to ensure your wage data communicates effectively and resonates with your audience.
Designing Story Reports
Technical Documentation for Template Stories in People Analytics.pdf
Using Stories in People Analytics Templates
Ensuring Logic and Precision in Your Calculations
Prioritize the validation of date fields to prevent any errors that might compromise the accuracy of your calculations. In Story Reports, the calculation logic closely mirrors that of Excel, allowing for individualized scrutiny.
A common oversight involves the division of Column A by Column B, where Column B should never contain values such as '0' or 'Null'. While seemingly straightforward, this crucial check can be easily missed, especially when handling extensive datasets.
Clear Definition of New Hires and Leavers
Revisit the fundamental question of your analysis: What do you aim to derive from the data, and what is the overarching purpose of your reporting? Clearly defining these objectives significantly enhances the efficiency of both building and validating your calculations.
Exclude Skewing Data Points
Exercise caution to exclude data points that could potentially skew your results, such as global assignments. Regularly reviewing the data at each construction step of your report is a prudent practice. Special cases like rehires, reporting no-shows, global assignments, or short assignments demand careful consideration and may necessitate exclusion or inclusion in your calculations.
Maintaining vigilance throughout the construction of your report ensures robust and reliable analytics that align seamlessly with your organizational goals.
As we conclude this journey into the realms of data visualization, remember that the power of your narrative lies not just in the story but in how it's presented. SAP equips you with a trove of resources to harness the numerical prowess of your data. Whether through charts, numerical displays, heatmaps, or other visual formats, the possibilities are boundless.
So, dive in, explore, and let your data speak volumes. Transform it into a visual symphony that captivates, informs, and empowers your audience. With SAP's tools and your newfound skills, your data will not just be seen; it'll be experienced.
Illuminate your insights. Enchant your audience. Unleash the numerical magic within your data. The stage is yours.
Prerequisites:
Prior to embarking on the steps outlined in this blog, it's essential to ensure that you've established the month start and end dates in your query. If you haven't done so yet, refer to the previous blog:
Creating Month Start and End Dates for Headcount Follow-Up in Story Reports. These dates are not just prerequisites; they are the bedrock of our trend analysis.
In this illustrative example, we've crafted backdated month start and end dates, aligning with the purpose of reporting historical data. It's noteworthy to mention that if your analysis focuses on future reporting, the logic remains consistent. Simply replace "-1" with "+1" in the formula, and the results will seamlessly display the month start and end dates in the future.

For example, replace -1 into +1 in this formula. And name it differently than in the screenshot
Technical Steps: Building the Trend Report
- Review available hire date and end of employment date
Before diving into the calculations, carefully review the hire date and end of employment date available in your system. These dates are pivotal for defining new hires and leavers in your workforce analytics. However, it's important to note that your system environment might present variations, especially in cases of rehires or different termination events.
In Employment details, you may encounter multiple dates associated with new hires (in instances of rehires) or termination events (such as last working date or termination date). Take a comprehensive look at the available dates and designate one as the definitive hire date and another as the end of employment date.
For the purposes of this blog, we'll be utilizing the hire date and end of employment date in our calculations.
- Create Calculated Columns to count New Hires and Leavers in last 6 months
New hires in last 1 month:
IF(ISNULL([Employment#Job Information#Is Host Assignment] )  ,

 IF([Employment#Job Information#Hire Date] >= [LASTMONTH1STDAY]

AND[Employment#Job Information#Hire Date]<= [LASTMONTHENDDAY], 1, 0 ),0)
It's crucial to recognize that global assignments constitute a unique scenario. In the context of employees' host profiles, the hire date is not necessarily align with the date of their employment start within the organization. Consequently, host profiles are not considered new hires in the example provided. Don't worry, global assignment employees have HOME profile and the dates will be taken into consideration as normal. So they are not counted twice nor counted incorrectly as a new hire or a leaver.
Note: The terms "[Last month 1st date]" and "[last month end date]" are placeholders, and their actual names may vary based on the specific calculated column IDs you've created. When formulating the formula, the system will automatically display available tokens for your convenience.
With this understanding in place, let's apply the same logic to generate the remaining five calculated columns for new hires, extending from the last two months to the last six months.
Leavers in last 1 month:
If there has been no termination action done in the system, the end of employment date for an employee is empty (Null), and empty value will always lead to errors in calculation.
Therefore, we have to give a date value for those employees who have no end of employment date by creating a calculated column named as "Termination Date" in the example.
IF( ISNULL([Employment#Job Information#End of Employment date] ),

TODATE("12/31/9999" ,"mm/dd/yyyy"),

 [Employment#Job Information#End of Employment date])
Here is a preview of the results of this column:

Once those dates are ready, let's count the employees who left the organization in last 1 month:
IF([Employment#Job Information#Is Host Assignment]="1"

,0 ,

IF([ENDOFEMPLOYMENTDATE] >= [LASTMONTH1STDAY] AND

[ENDOFEMPLOYMENTDATE] <=[LASTMONTHENDDAY] , 1, 0 ))
Again, employees who have been back from a global assignment will have an end of employment date or termination date on their HOST profile, and we need to exclude the count on HOST profiles because the dates indicate only the period of the global assignment.
Continue to complete the rest calculations for the other five months.

Reminder: be aware of the technical limitation in the query: 30 data tables and 120 columns.
Save your query at this point before continue.
3. Table List Validation
To guarantee the accuracy of your calculated columns or investigate possible errors, it's imperative to perform a thorough validation using a table list in Story Reports.
If you're new to creating a table list report or seeking additional tips, refer to this insightful blog: Creating Table Lists and Cross-Tab Tables in SAP SuccessFactors Story Reports
Validating your calculations through a table list not only enhances precision but also provides a visual confirmation of the data utilized in your Story Reports. It is recommended to export the list and cross check in Excel. This step is integral to building robust and dependable workforce analytics.
Current month when creating this blog is Dec, 2023
Example of exported list:
| Employee Number | Assignment Type | Current month 1st day | Employee Class | Employment Status | End of Employment date | Hire Date | Termination date | Last 1 month 1st day | Last 1 month end date | Last 2 month 1st day | Last 2 month end date | last 3 month 1st day | Last 3 month end date | New hire last 1 month | New hires last 2 month | New hires last 3 month | New hires last 4 month | Leavers last 1 month | Leavers last 2 month | Leavers last 3 month | Leavers last 4 month |
| 110328 | ST | Dec 1, 2023 | Employee | Active | – | Nov 16, 2023 | Dec 31, 9999 | Nov 1, 2023 | Nov 30, 2023 | Oct 1, 2023 | Oct 31, 2023 | Sep 1, 2023 | Sep 30, 2023 | 1 | 0 | 0 | 0 | 0 | 0 | 0 | 0 |
| 110329 | ST | Dec 1, 2023 | Employee | Active | Nov 30, 2024 | Nov 17, 2023 | Nov 30, 2024 | Nov 1, 2023 | Nov 30, 2023 | Oct 1, 2023 | Oct 31, 2023 | Sep 1, 2023 | Sep 30, 2023 | 1 | 0 | 0 | 0 | 0 | 0 | 0 | 0 |
| 110330 | ST | Dec 1, 2023 | Employee | Active | Dec 31, 2023 | Nov 17, 2023 | Dec 31, 2023 | Nov 1, 2023 | Nov 30, 2023 | Oct 1, 2023 | Oct 31, 2023 | Sep 1, 2023 | Sep 30, 2023 | 1 | 0 | 0 | 0 | 0 | 0 | 0 | 0 |
| 286 | ST | Dec 1, 2023 | External | Active | Nov 17, 2024 | Nov 17, 2023 | Nov 17, 2024 | Nov 1, 2023 | Nov 30, 2023 | Oct 1, 2023 | Oct 31, 2023 | Sep 1, 2023 | Sep 30, 2023 | 1 | 0 | 0 | 0 | 0 | 0 | 0 | 0 |
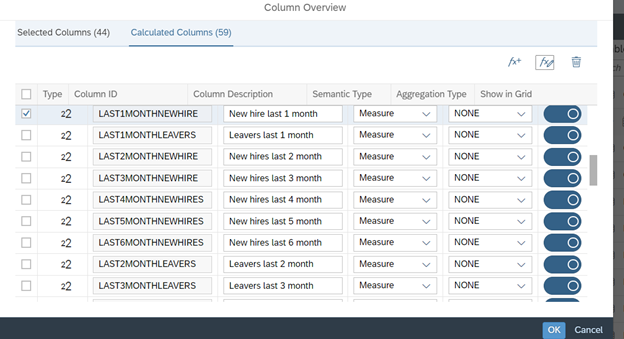
In the screenshot below, you can find part of the Columns used in the Builder for the list report.

Table list in story for validation
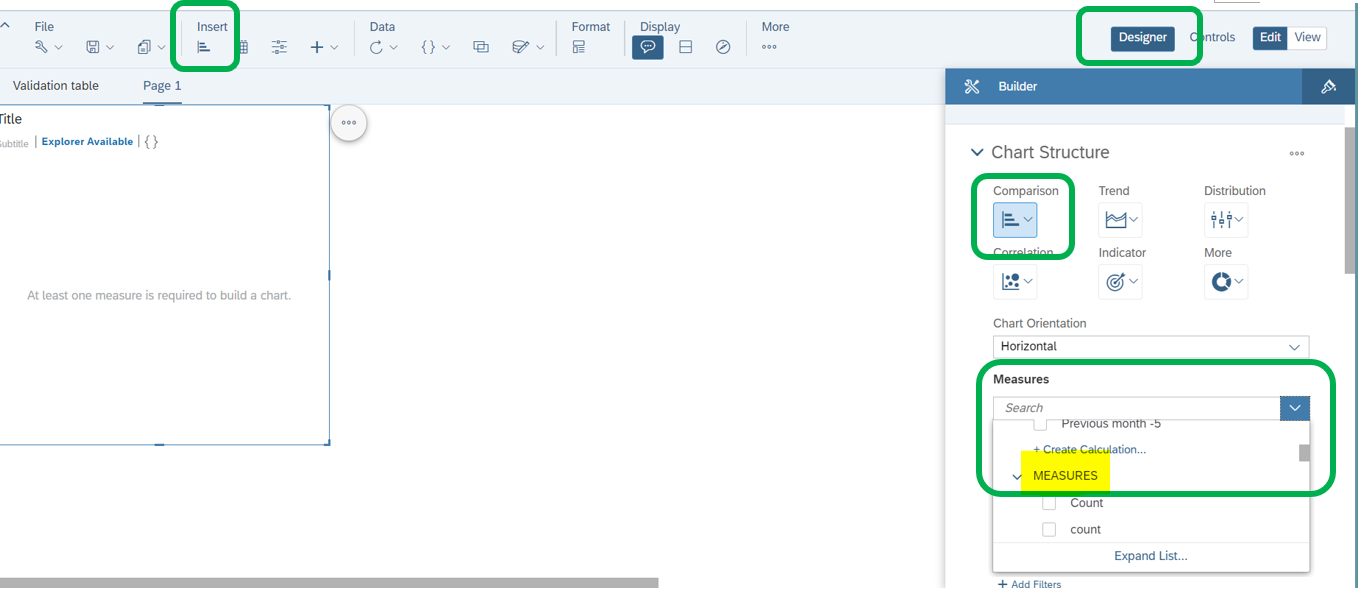
4. Create a Canvas page for analysis visualizations

Build a Canvas Page in Story Reports and add necessary visualizations.
- Showcase monthly trends, year-to-date summaries, and any other relevant analyses.
To master the art of crafting compelling wage visuals, explore SAP's comprehensive materials. Whether you're delving into charts, numerical displays, heatmaps, or other formats, SAP provides the resources you need. Elevate your presentation game with the tools and insights offered by SAP to ensure your wage data communicates effectively and resonates with your audience.
Designing Story Reports
Technical Documentation for Template Stories in People Analytics.pdf
Using Stories in People Analytics Templates
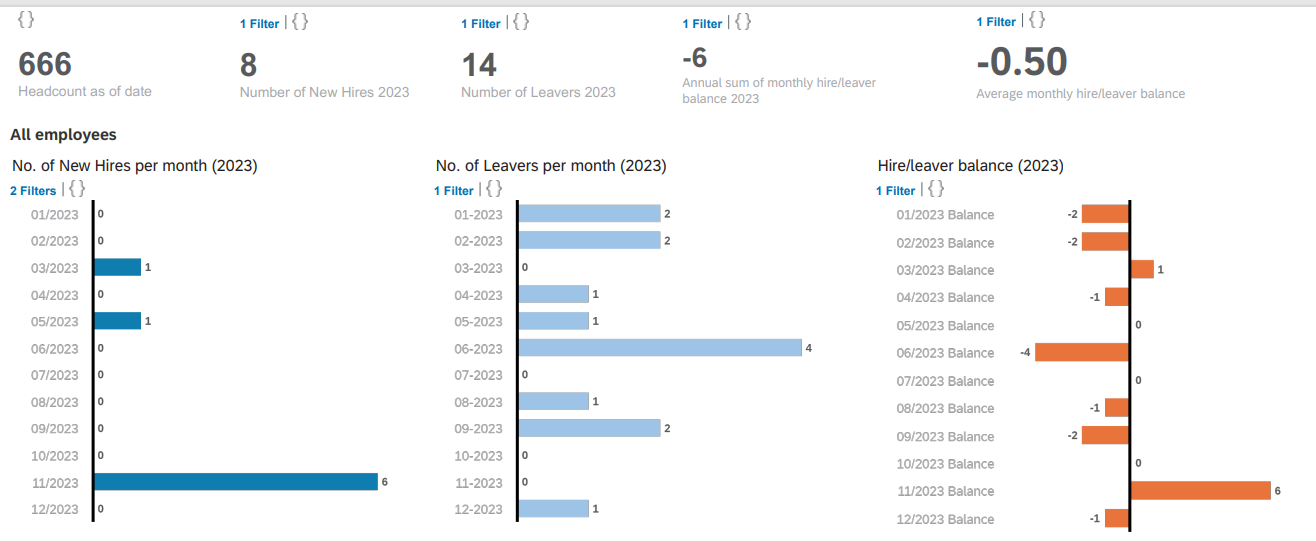
If you're keen on showcasing new hires or leavers by calendar month within a year, here is an example what could be visualized in canvas page in story report. The magic happens with the start and end dates you choose for your counting formulas. Ready to bring your data to life, one month at a time?
Considerations and Best Practices:
Ensuring Logic and Precision in Your Calculations
Prioritize the validation of date fields to prevent any errors that might compromise the accuracy of your calculations. In Story Reports, the calculation logic closely mirrors that of Excel, allowing for individualized scrutiny.
A common oversight involves the division of Column A by Column B, where Column B should never contain values such as '0' or 'Null'. While seemingly straightforward, this crucial check can be easily missed, especially when handling extensive datasets.
Clear Definition of New Hires and Leavers
Revisit the fundamental question of your analysis: What do you aim to derive from the data, and what is the overarching purpose of your reporting? Clearly defining these objectives significantly enhances the efficiency of both building and validating your calculations.
Exclude Skewing Data Points
Exercise caution to exclude data points that could potentially skew your results, such as global assignments. Regularly reviewing the data at each construction step of your report is a prudent practice. Special cases like rehires, reporting no-shows, global assignments, or short assignments demand careful consideration and may necessitate exclusion or inclusion in your calculations.
Maintaining vigilance throughout the construction of your report ensures robust and reliable analytics that align seamlessly with your organizational goals.
Unlocking Numerical Brilliance: A Visual Symphony of Your Data
As we conclude this journey into the realms of data visualization, remember that the power of your narrative lies not just in the story but in how it's presented. SAP equips you with a trove of resources to harness the numerical prowess of your data. Whether through charts, numerical displays, heatmaps, or other visual formats, the possibilities are boundless.
So, dive in, explore, and let your data speak volumes. Transform it into a visual symphony that captivates, informs, and empowers your audience. With SAP's tools and your newfound skills, your data will not just be seen; it'll be experienced.
Illuminate your insights. Enchant your audience. Unleash the numerical magic within your data. The stage is yours.
You must be a registered user to add a comment. If you've already registered, sign in. Otherwise, register and sign in.
Labels in this area
-
1H 2024 Product Release
5 -
2H 2023 Product Release
1 -
ACCRUAL TRANSFER
1 -
Advanced Workflow
1 -
Anonymization
1 -
BTP
1 -
Business Rules
1 -
Canvas Report
1 -
Career Development
1 -
Certificate-Based Authentication
1 -
Cloud Platform Integration
1 -
Compensation
1 -
Compensation Information Management
1 -
Compensation Management
1 -
Compliance
2 -
Content
1 -
Conversational AI
2 -
Custom Data Collection
1 -
custom portlet
1 -
Data & Analytics
1 -
Data Integration
1 -
Dayforce
1 -
deep link
1 -
deeplink
1 -
Delimiting Pay Components
1 -
Deprecation
1 -
Employee Central
1 -
Employee Central Global Benefits
1 -
Employee Central Payroll
1 -
employee profile
1 -
Employee Rehires
1 -
external terminal
1 -
external time events
1 -
Generative AI
2 -
Getting Started
1 -
Global Benefits
1 -
Guidelines
1 -
H2 2023
1 -
HR
2 -
HR Data Management
1 -
HR Transformation
1 -
ilx
1 -
Incentive Management Setup (Configuration)
1 -
Integration Center
2 -
Integration Suite
1 -
internal mobility
1 -
Introduction
1 -
learning
3 -
LMS
2 -
LXP
1 -
Massively MDF attachments download
1 -
Mentoring
1 -
Metadata Framework
1 -
Middleware Solutions
1 -
OCN
1 -
OData APIs
1 -
ONB USA Compliance
1 -
Onboarding
2 -
Opportunity Marketplace
1 -
Pay Component Management
1 -
Platform
1 -
portlet
1 -
POSTMAN
1 -
Predictive AI
2 -
Recruiting
1 -
recurring payments
1 -
Role Based Permissions (RBP)
2 -
SAP Build CodeJam
1 -
SAP Build Marketplace
1 -
SAP CPI (Cloud Platform Integration)
1 -
SAP HCM (Human Capital Management)
2 -
SAP HR Solutions
2 -
SAP Integrations
1 -
SAP release
1 -
SAP successfactors
5 -
SAP SuccessFactors Customer Community
1 -
SAP SuccessFactors OData API
1 -
SAP Workzone
1 -
SAP-PAYROLL
1 -
skills
1 -
Skills Management
1 -
sso deeplink
1 -
Stories in People Analytics
3 -
Story Report
1 -
SuccessFactors
2 -
SuccessFactors Employee central home page customization.
1 -
SuccessFactors Onboarding
1 -
successfactors onboarding i9
1 -
Table Report
1 -
talent
1 -
Talent Intelligence Hub
2 -
talents
1 -
Tax
1 -
Tax Integration
1 -
Time Accounts
1 -
Workflows
1 -
XML Rules
1
Related Content
- New 1H 2024 SAP Successfactors Time (Tracking) Features in Human Capital Management Blogs by SAP
- 1H 2024 - Release highlights of SuccessFactors Succession Planning in Human Capital Management Blogs by Members
- First Half 2024 Release: What’s New in SAP SuccessFactors HCM in Human Capital Management Blogs by SAP
- 3 key steps to kick-start your migration to Stories in People Analytics in Human Capital Management Blogs by Members
- Simplifying Employee and Manager Experiences with Employee Central Quick Actions in Human Capital Management Blogs by SAP
Top kudoed authors
| User | Count |
|---|---|
| 16 | |
| 12 | |
| 4 | |
| 3 | |
| 3 | |
| 1 | |
| 1 | |
| 1 | |
| 1 | |
| 1 |