- SAP Community
- Products and Technology
- Technology
- Technology Q&A
- Issue with Donut Chart - Data Label Total Percenta...
- Subscribe to RSS Feed
- Mark Question as New
- Mark Question as Read
- Bookmark
- Subscribe
- Printer Friendly Page
- Report Inappropriate Content
Issue with Donut Chart - Data Label Total Percentage is 100.1%
- Subscribe to RSS Feed
- Mark Question as New
- Mark Question as Read
- Bookmark
- Subscribe
- Printer Friendly Page
- Report Inappropriate Content
on 07-19-2023 7:59 AM
Hi All,
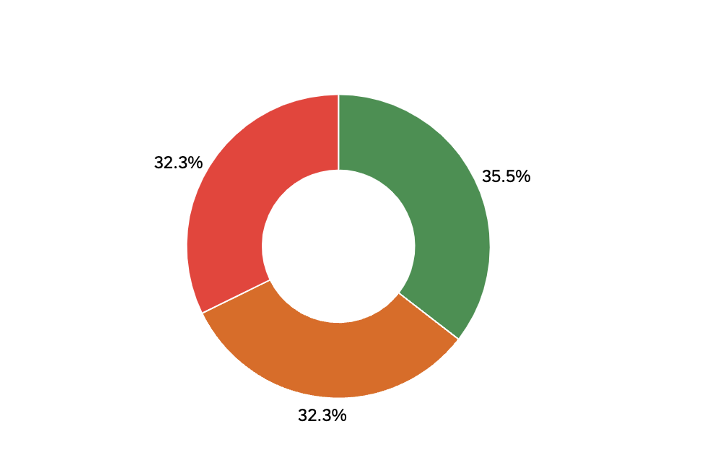
I am using Donut Chart from VizFrame Charts to display the statuses of the system. By default, I have enabled to display data label, which will show the percentage of each status against total records. When I have tried to add up the percentage of all the statuses, it comes as 100.1%. Attaching the screenshot for reference. In the screenshot, total percentage is 35.5% + 32.3% + 32.3% = 100.1%. Is there any workaround to show as 36% + 32% + 32% = 100%
Can someone help me on how to go approach this issue?
Thanks,
Madhu
- SAP Managed Tags:
- SAPUI5
Accepted Solutions (0)
Answers (1)
Answers (1)
- Mark as New
- Bookmark
- Subscribe
- Subscribe to RSS Feed
- Report Inappropriate Content
The reason why the percentages in your donut chart add up to 100.1% is because the data labels are rounded to two decimal places. If you round the percentages to one decimal place, the total will be 100%.
To do this, you can use the following code:
var donutChart = new VizFrame.DonutChart({
  ...
  dataLabels: {
    enabled: true,
    formatter: function(value) {
      return value.toFixed(1);
    }
  }
});
This code will round the percentages in the data labels to one decimal place.
You can also use the following code to round the percentages in the donut chart itself:
var donutChart = new VizFrame.DonutChart({
  ...
  values: [35.5, 32.3, 32.3],
  donutStyle: {
    innerRadius: 0.7,
    valueFormatter: function(value) {
      return value.toFixed(1);
    }
  }
});
This code will round the percentages in the donut chart itself to one decimal place.
Once you have made these changes, the percentages in your donut chart will add up to 100%.
You must be a registered user to add a comment. If you've already registered, sign in. Otherwise, register and sign in.
- Mark as New
- Bookmark
- Subscribe
- Subscribe to RSS Feed
- Report Inappropriate Content
Hi yoganandamuthaiah,
Thanks for your response. I am having Donut Chart Configuration as follows, and I am seeing only formatString option not formatter under vizProperties.plotArea.dataLabel. Can you please help me on this,
settingsModel: {
    name: "Donut",
        vizType: "donut",
            value: ["Records"],
                dataset: {
        dimensions: [
            {
                name: "Status",
                value: "{Status}"
            }
        ],
            measures: [
                {
                    name: "Records",
                    value: "{Records}"
                }
            ],
                data: {
            path: "/values"
        }
    },
    vizProperties: {
        title: {
            visible: false
        },
        legend: {
            visible: true
        },
        legendGroup: {
            layout: {
                position: "right",
                    alignment: "center",
                        fontSize: "24px"
            }
        },
        plotArea: {
            dataLabel: {
                visible: true
            },
            dataPointStyle: {
                rules:
                [
                ]
            }
        }
    }
}- Exploring ML Explainability in SAP HANA PAL – Classification and Regression in Technology Blogs by SAP
- What’s New in SAP Datasphere Version 2024.10 — May 7, 2024 in Technology Blogs by Members
- Tracking HANA Machine Learning experiments with MLflow: A technical Deep Dive in Technology Blogs by SAP
- SAP Analytics Cloud: Support Universal Account Model (UAM) with Custom Widget in Technology Blogs by SAP
- Sorting not working on object Page Item table SAP CAP BTP Fiori elements in Technology Q&A
| User | Count |
|---|---|
| 78 | |
| 9 | |
| 8 | |
| 6 | |
| 6 | |
| 6 | |
| 6 | |
| 6 | |
| 5 | |
| 4 |
You must be a registered user to add a comment. If you've already registered, sign in. Otherwise, register and sign in.