
- SAP Community
- Products and Technology
- Technology
- Technology Blogs by SAP
- What’s New in SAP Analytics Cloud Release 2022.07
Technology Blogs by SAP
Learn how to extend and personalize SAP applications. Follow the SAP technology blog for insights into SAP BTP, ABAP, SAP Analytics Cloud, SAP HANA, and more.
Turn on suggestions
Auto-suggest helps you quickly narrow down your search results by suggesting possible matches as you type.
Showing results for
Product and Topic Expert
Options
- Subscribe to RSS Feed
- Mark as New
- Mark as Read
- Bookmark
- Subscribe
- Printer Friendly Page
- Report Inappropriate Content
03-30-2022
1:21 AM
SAP Analytics Cloud is a single solution for business intelligence (BI), augmented and predictive analytics, and enterprise planning with the power of artificial intelligence and machine learning technology. It helps everyone in your organization make fast, confident decisions.
This blog post introduces the features of the SAP Analytics Cloud 2022.07 release available for SAP Analytics Cloud FastTrack customers. For SAP Analytics Cloud Quarterly Release Cycle (QRC) customers, this release and its features will be available as part of the QRC Q2 2022 release. View the QRC release schedule here.
This is an extension feature of the existing SAP Analytics Cloud Performance Statistics and Analysis and introduces a new story page for content visualization.
This enables customers to:
For more details, check out this blog post, by thomas.fery .
This new feature is a new story page that provides an overview of Data Management Jobs including statistics and analysis, and import and export schedules.
For more details, check out this blog post, by thomas.fery .
Optimized View Mode (OVM) can now be enabled for Analytic Applications and includes:
Application designers can use the getActiveSelectedMember API to get the active dimension members selected from input controls. The API will also get the cascading down values from the input control, which can be used to filter other widgets or feed data actions.
Note that the API isn’t supported for excluded members selected from input controls. For performance consideration, we recommend using it for input controls with low cardinality dimensions or turning on cascading effect to narrow down dimension members in input controls.
At design time, users can select Performance Optimization -> Analyze Script Performance in Runtime from the toolbar to run the application with the script performance popup. Once the application finishes loading, the pop up can be opened through shortcut keys Ctrl+Shift+A or Ctrl+Shift+Z.
This makes it easier for users to analyze application performances without having to manually add the parameter APP_PERFORMANCE_LOGGING=true to the application URL.
The publish & leave dialog is now implemented in Analytic Application, to improve the planning user's data publish experience.
If you do not want to see this dialog at runtime, at design time, go to the Styling panel of canvas, and under Planning Settings, deselect "Remind of publishing all data changes before leaving".
Bookmarks have been enhanced and provide more customization for application developers to save bookmarks with the last changed dynamic variables values. Choosing this option will override the default prompts settings defined at the model level. Settings can be modified in settings in Analytic Application Details at design time and application developers can update the script API to set the behavior dynamically at runtime.
Previously, when users selected filter values via API at runtime, the operation may have changed the selection mode set at design time. Based on customer requests for improvements, the following enhancements have been added to improve filter selection mode:
Application designers can create calculation input controls based on restricted measures to compare measures of restricted dimension members within or outside hierarchies simply by filtering. Supported widgets are charts, tables, R visualizations, and value driver trees. Analytics Design specific features are also supported, including:
Performance has been enhanced for tables in optimized presentation mode. Columns are now rendered on demand when scrolling a table horizontally, resulting in improved performance.
We are excited to announce the initial release of Optimized Design Experience (ODE), with this wave release. The Optimized Design Experience provides a better designer experience for IT and Analysts when designing large and complex stories with the introduction of several useability improvements.
Within the Optimized Design Experience:
Optimized Design Experience is currently supported for stories based on SAP HANA, SAP BW, and Acquired Analytics Data Models.
With Optimized Design Experience we allow the Story Designer to create new stories or convert existing stories into the new experience. The conversion of these stories are permanent and any unsupported feature will be permanently lost.
Optimized View Mode now supports the following features once the story is resaved:
The Data Export API now supports 3-legged OAuth, which complements the 2-Legged OAuth supported in the initial release. 2-Legged OAuth support in the initial release allowed administrators to access and export entire datasets from any given models in machine to machine scenarios. With 3-Legged OAuth, the Data Export API now offers more flexibility for specific workflows where you’d want to export smaller subsets of data to SAP Analytics Cloud business users, while still leveraging roles and data access privileges to ensure that they only access data they have been granted at a model level.
We have added a new toggle in the modeler that lets users decide if unpublished data should be shown in the data foundation. Furthermore, users can now select and show data of private versions. Previously, only public data was shown.
It’s now possible to import data to a model with measures and add new members to local dimensions, in addition to updating local dimension member properties. This improvement allows running a single import job with the new members, rather than running multiple jobs for each public dimension or maintaining local dimension members manually.
The calendar completion settings have been re-designed, making it easier for users to find and understand the cancel options for calendar events. This re-design mainly includes renaming the “Discontinue” functionality to “Cancel”, to reduce confusion for users and to simplify the term. Users can manually trigger and cancel an event via the status action menu.
We have also introduced an auto cancellation feature that can be enabled directly in the Time section of the event’s Details panel.
Task owners can now add assignees to automatic tasks – data actions, multi actions, and data locking tasks, even if they don’t have the appropriate permissions.
When a task owner adds an assignee, the owner will be promoted to start a permission request which will be sent to the assignee. The assignee can approve or decline the permission request. Once the assignee agrees, the task can run automatically at the specified start date or start condition, with the privileges of the assignee. If the assignee doesn’t grant permission before the task starts, its status will be set to Canceled.
This functionality also includes a re-design of reminders. Instead of using a separate reminders section, users can now add reminders to calendar events directly from the time section of the event’s Details panel. In addition to setting reminders before the due date, it’s now possible to set reminders before the start date of the event in the new ‘Add Reminders’ dialog.
Users can now specify a customized planning area for each private version copy and when editing public versions. This option will let you choose which data to put into edit mode, which can help further optimize performance or let you plan on data outside of the recommended planning area. However, publishing permissions are still required to publish data.
Users can now control how data is disaggregated, using the data disaggregation settings in the model preferences. Data Entry, Delete and Copy & Paste respect the data locks defined on the model. If you choose to disaggregate data based on data locks, locked child members will not receive values from parent members during planning If you choose to disaggregate data based on validation rules, invalid member combinations will not receive values during planning. Data locking-aware disaggregation can be enabled in the modeler or specifically for each table widget in a story.
Detailed statistics for planning operations and version size are now exposed to users. The version history panel also showcases the number of changed records for each step. These statistics provide users with a better understanding of planning model optimization and shows a benefit of setting a planning area.
Fluid Data Entry (FDE) provides a faster and smoother experience during planned data entry. Multiple data entries can be entered sequentially and will be processed as one batch. This prevents freezing of tables during value input, and users don’t need to wait for the system to update between every entry.
Multi action parameters defined against a public dimension can now be used across different models. The cross-model parameter can be used across models and steps within the same multi action designer. In the story designer, users can either choose member selection or link the filters to assign a value to the cross-model parameter. A value only needs to be assigned once and then it can be passed to steps across models, simplifying the workflow for a planning user. This improvement makes end-user operations more convenient and less error prone.
The MEMBERSET function now supports the unequal operator “!=”. Users can simplify advanced formulas and further define the scope of a member set based on this operator to exclude specific members.
Users can now see all table refresh states, as well as select a single table to be refreshed in the builder pane.
Users can use prompts to control currency, default, and non-default variables within in model. Prompts can be used for individual tables or a whole workbook.
Users can limit the results in the member selector through setting a property filter in the task pane to restrict members. This filter can be easily switched on and off as needed.
Introducing three custom functions:
These cell-based functions enable users with building more powerful workbooks with Excel power and easier functionality without needing to use the task pane.
This blog post introduces the features of the SAP Analytics Cloud 2022.07 release available for SAP Analytics Cloud FastTrack customers. For SAP Analytics Cloud Quarterly Release Cycle (QRC) customers, this release and its features will be available as part of the QRC Q2 2022 release. View the QRC release schedule here.
Release Highlights
- Administration & Service Management
- Backend Messages (Extension for Performance Statistics and Analysis)
- Data Management Job Statistics and Analysis
- Analytics Design
- Optimized View Mode for Analytic Applications
- Input Control Script API Enhancement
- Launch Script Performance Popup with One Click
- Publish and Leave Dialog for Planning
- Keep Last Saved Value of Dynamic Variable in Bookmark
- Filter Single / Multiple Selection Mode Improvement
- Support Calculation Input Control in Definition of Restricted Measure
- Dashboard & Story Design
- Improved Table Scrolling
- Initial Release of Optimized Design Experience
- Optimized View Mode Incremental Update
- Data Integration
- Data Modeling
- Further Enhancements Inside Data Preview in the Modeler
- Import Data into Local Dimension for Universal Model Support
- Enterprise Planning
- Redesign of Calendar Completion Settings
- Assignee Support for Automatic Calendar Tasks
- Customized Planning Area
- Data Locking-aware Data Disaggregation
- Version Size and Record Visibility
- Fluid Data Entry
- Public Dimension Parameter
- Advanced Formulas: Support MEMBERSET filter with no equal condition
- Microsoft Office Integration
- Show Refresh State in Task Pane
- Prompts (SAP Analytics Cloud Scope)
- Filter by Property in Member Selector
- Cell-based formulas for calling member selector
Administration & Service Management
Backend Messages (Extension for Performance Statistics and Analysis)
This is an extension feature of the existing SAP Analytics Cloud Performance Statistics and Analysis and introduces a new story page for content visualization.
This enables customers to:
- Perform error/warning message reporting
- Identify users having issues
- Identify resources having issues
For more details, check out this blog post, by thomas.fery .

Data Management Job Statistics and Analysis
This new feature is a new story page that provides an overview of Data Management Jobs including statistics and analysis, and import and export schedules.
For more details, check out this blog post, by thomas.fery .

Analytics Design
Optimized View Mode for Analytic Applications
Optimized View Mode (OVM) can now be enabled for Analytic Applications and includes:
- Applicable improvements available in story are available in analytic applications
- Usability Improvements
- Performance Improvements depends on scenarios
- Analytics Designer specific widgets moved to Optimized View Mode
- Analytics Designer scripts/events moved to Optimized View Mode
- New APIs are added to Optimized View Mode
- Custom Widget with Data Binding

Input Control Script API Enhancement
Application designers can use the getActiveSelectedMember API to get the active dimension members selected from input controls. The API will also get the cascading down values from the input control, which can be used to filter other widgets or feed data actions.
Note that the API isn’t supported for excluded members selected from input controls. For performance consideration, we recommend using it for input controls with low cardinality dimensions or turning on cascading effect to narrow down dimension members in input controls.

Launch Script Performance Popup with One Click
At design time, users can select Performance Optimization -> Analyze Script Performance in Runtime from the toolbar to run the application with the script performance popup. Once the application finishes loading, the pop up can be opened through shortcut keys Ctrl+Shift+A or Ctrl+Shift+Z.
This makes it easier for users to analyze application performances without having to manually add the parameter APP_PERFORMANCE_LOGGING=true to the application URL.

Publish and Leave Dialog for Planning
The publish & leave dialog is now implemented in Analytic Application, to improve the planning user's data publish experience.

If you do not want to see this dialog at runtime, at design time, go to the Styling panel of canvas, and under Planning Settings, deselect "Remind of publishing all data changes before leaving".
Keep Last Saved Value of Dynamic Variable in Bookmark
Bookmarks have been enhanced and provide more customization for application developers to save bookmarks with the last changed dynamic variables values. Choosing this option will override the default prompts settings defined at the model level. Settings can be modified in settings in Analytic Application Details at design time and application developers can update the script API to set the behavior dynamically at runtime.

Filter Single / Multiple Selection Mode Improvement
Previously, when users selected filter values via API at runtime, the operation may have changed the selection mode set at design time. Based on customer requests for improvements, the following enhancements have been added to improve filter selection mode:
- Now if you select multiple values via API such as setDimensionFilter at runtime while the filter is set to single selection mode at design time, the value selection will be ignored as it’s inconsistent with the original filter selection mode
- The previous selection mode will be kept when the filter is added back after removal.
Support Calculation Input Control in Definition of Restricted Measure
Application designers can create calculation input controls based on restricted measures to compare measures of restricted dimension members within or outside hierarchies simply by filtering. Supported widgets are charts, tables, R visualizations, and value driver trees. Analytics Design specific features are also supported, including:
- Outline
- Design time show/hide
- Order
- Additional settings in Styling Panel
- Size/position
- Runtime visibility
- Popup support
- Theme
- Script API to set visibility, layout

Dashboard & Story Design
Improved Table Scrolling
Performance has been enhanced for tables in optimized presentation mode. Columns are now rendered on demand when scrolling a table horizontally, resulting in improved performance.
Initial Release of Optimized Design Experience
We are excited to announce the initial release of Optimized Design Experience (ODE), with this wave release. The Optimized Design Experience provides a better designer experience for IT and Analysts when designing large and complex stories with the introduction of several useability improvements.
Within the Optimized Design Experience:
- Story Designers are exposed to the same usability improvements that were delivered with Optimized View Mode (i.e. Ghost Loading Indicators, Improved Hierarchy Navigation, and so on)
- Introduction of a new Chart Builder Panel and the Available Object List for a better creation experience
- Experience a seamless transition between Optimized View Mode and Optimized Design Experience
Optimized Design Experience is currently supported for stories based on SAP HANA, SAP BW, and Acquired Analytics Data Models.
With Optimized Design Experience we allow the Story Designer to create new stories or convert existing stories into the new experience. The conversion of these stories are permanent and any unsupported feature will be permanently lost.
- Creating a New Story
- With the selection of Responsive or Canvas the Story Designer will be prompted an option to select Optimized Design Experience or Classic Design Experience Ability
- Creating a Story in the Optimized Design Experience does not allow you to convert into Classic Design Experience.
- Optimized Design Experience contains a documentation of available features under “Learn More”

- Converting an Existing Story
- With any existing story in Classic Design Experience we provide an option for the Story Designer to convert the story into the Optimized Design Experience
- The conversion to the Optimized Design Experience is permanent and any unsupported feature will be permanently lost
- The detection of a blocking feature will prevent you from converting the story to Optimized Design Experience

Optimized View Mode Incremental Update
Optimized View Mode now supports the following features once the story is resaved:
- Story and Models:
- Planning Data Models (includes Classic and New Model Type)
- Planning Features (i.e. Data Action, Forecast Layout, and so on)
- Dynamic Text for Optimized Presentation Table (Local Filters and Variables)
- Story Reset
- Data Point Commenting
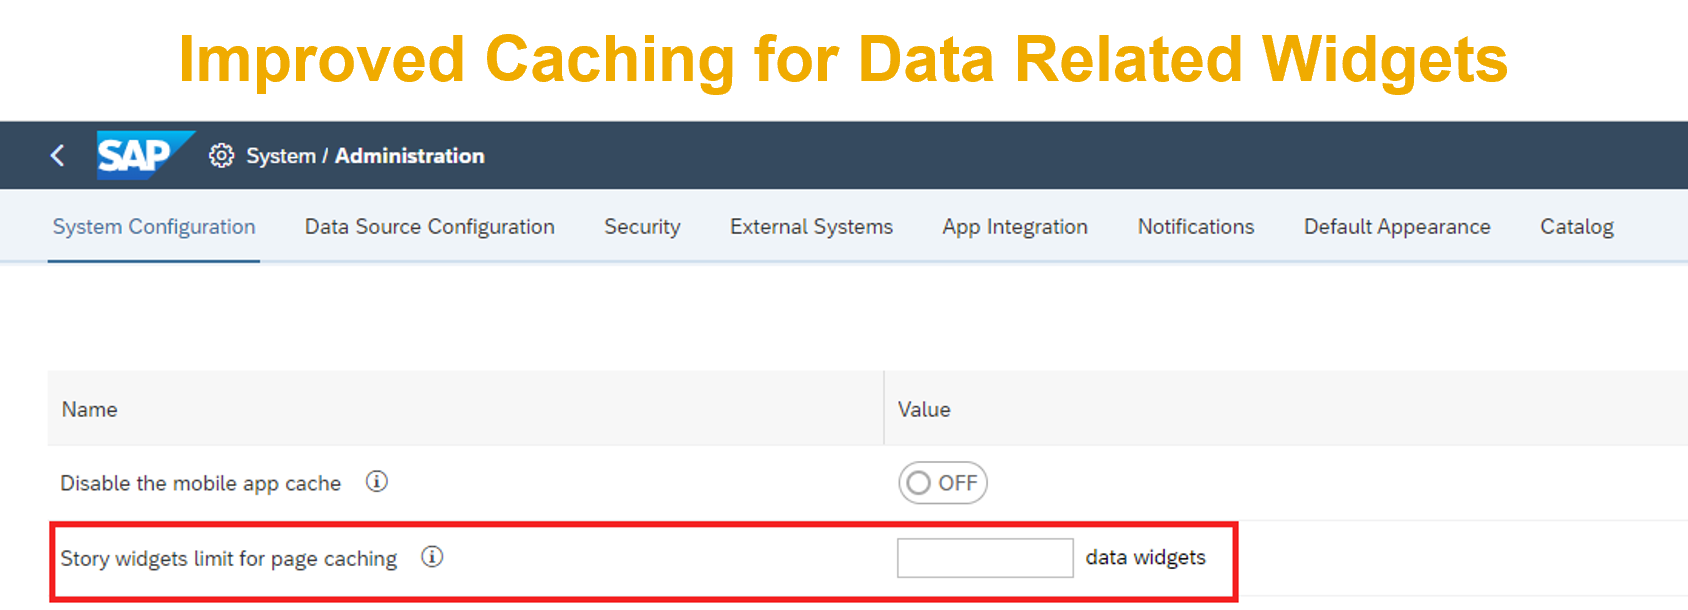
- Improved Caching Logic for 50+ Data Related Widgets. System administrators can now determine what the number of data related widgets caching limit is.
- Visualizations
- Choropleth Layer with Live BW Data Models
- Filter / Input Controls and Calculations
- Time Range Filters with Single Value Slider

Data Integration
Data Export API - 3 Legged OAuth
The Data Export API now supports 3-legged OAuth, which complements the 2-Legged OAuth supported in the initial release. 2-Legged OAuth support in the initial release allowed administrators to access and export entire datasets from any given models in machine to machine scenarios. With 3-Legged OAuth, the Data Export API now offers more flexibility for specific workflows where you’d want to export smaller subsets of data to SAP Analytics Cloud business users, while still leveraging roles and data access privileges to ensure that they only access data they have been granted at a model level.

Data Modeling
Further Enhancements Inside Data Preview in the Modeler
We have added a new toggle in the modeler that lets users decide if unpublished data should be shown in the data foundation. Furthermore, users can now select and show data of private versions. Previously, only public data was shown.

Import Data into Local Dimension for Universal Model Support
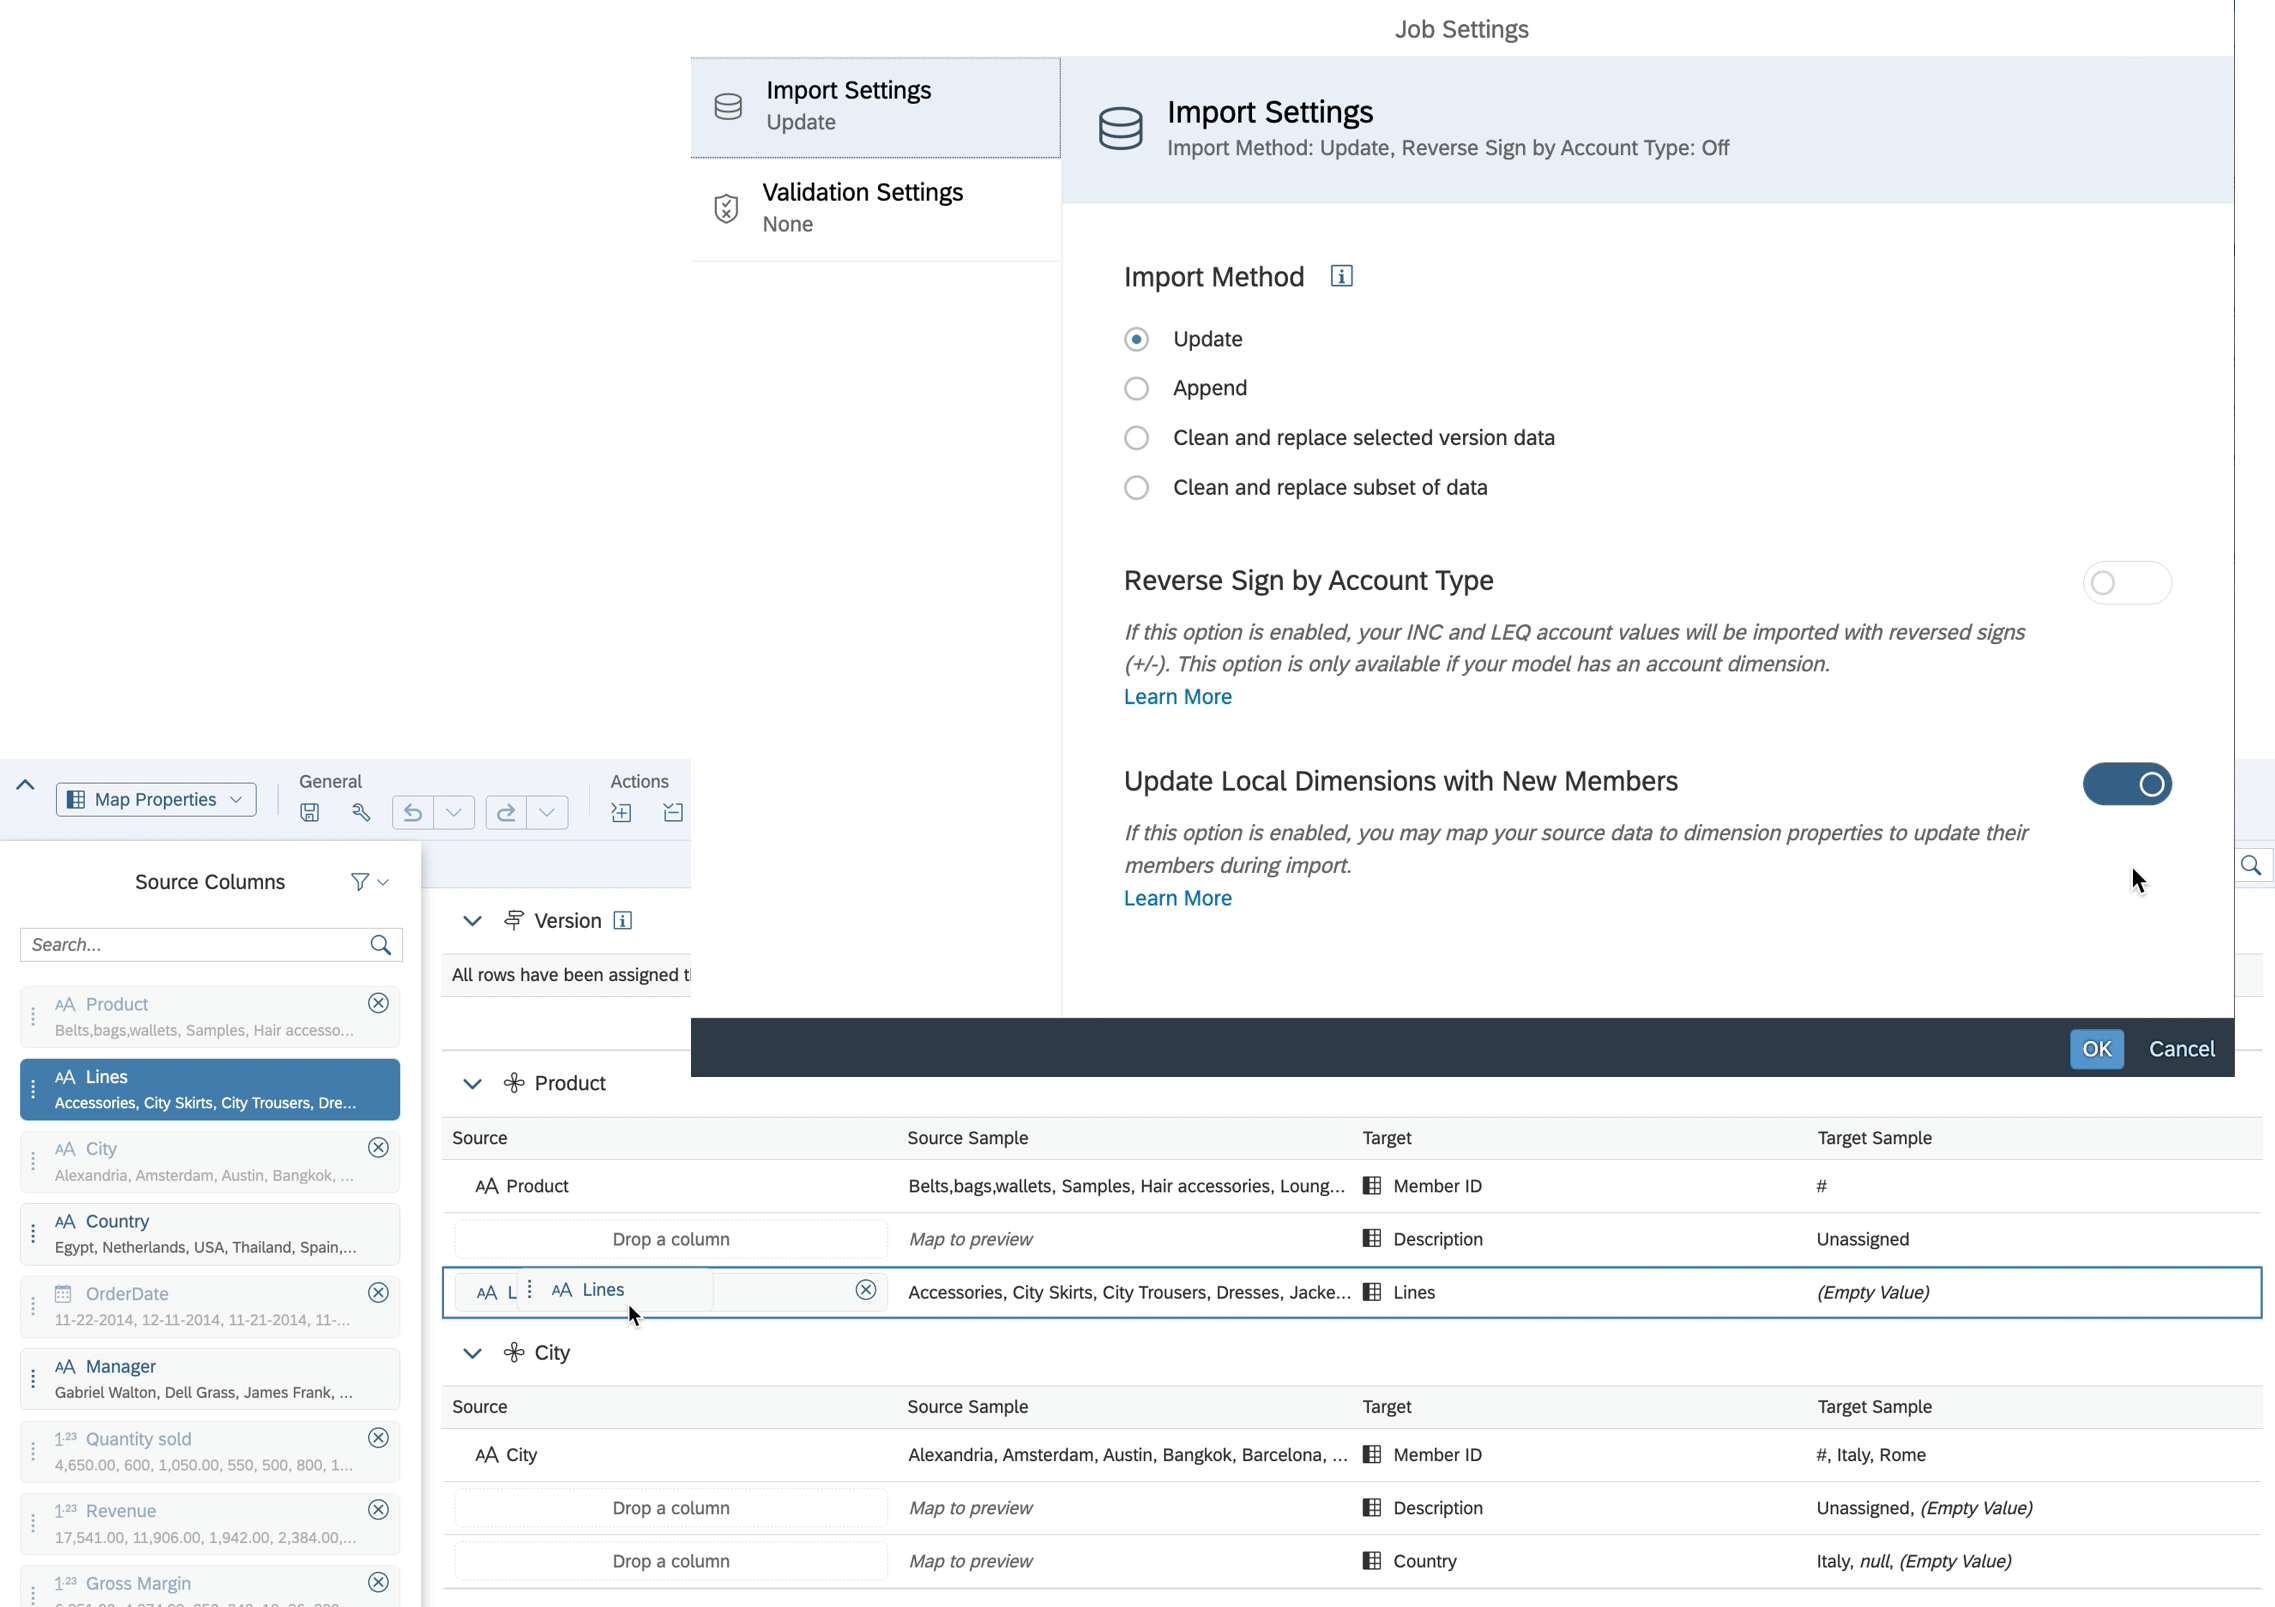
It’s now possible to import data to a model with measures and add new members to local dimensions, in addition to updating local dimension member properties. This improvement allows running a single import job with the new members, rather than running multiple jobs for each public dimension or maintaining local dimension members manually.
Enterprise Planning
Redesign of Calendar Completion Settings
The calendar completion settings have been re-designed, making it easier for users to find and understand the cancel options for calendar events. This re-design mainly includes renaming the “Discontinue” functionality to “Cancel”, to reduce confusion for users and to simplify the term. Users can manually trigger and cancel an event via the status action menu.

We have also introduced an auto cancellation feature that can be enabled directly in the Time section of the event’s Details panel.

Assignee Support for Automatic Calendar Tasks
Task owners can now add assignees to automatic tasks – data actions, multi actions, and data locking tasks, even if they don’t have the appropriate permissions.
When a task owner adds an assignee, the owner will be promoted to start a permission request which will be sent to the assignee. The assignee can approve or decline the permission request. Once the assignee agrees, the task can run automatically at the specified start date or start condition, with the privileges of the assignee. If the assignee doesn’t grant permission before the task starts, its status will be set to Canceled.
This functionality also includes a re-design of reminders. Instead of using a separate reminders section, users can now add reminders to calendar events directly from the time section of the event’s Details panel. In addition to setting reminders before the due date, it’s now possible to set reminders before the start date of the event in the new ‘Add Reminders’ dialog.

Customized Planning Area
Users can now specify a customized planning area for each private version copy and when editing public versions. This option will let you choose which data to put into edit mode, which can help further optimize performance or let you plan on data outside of the recommended planning area. However, publishing permissions are still required to publish data.

Data Locking-aware Data Disaggregation
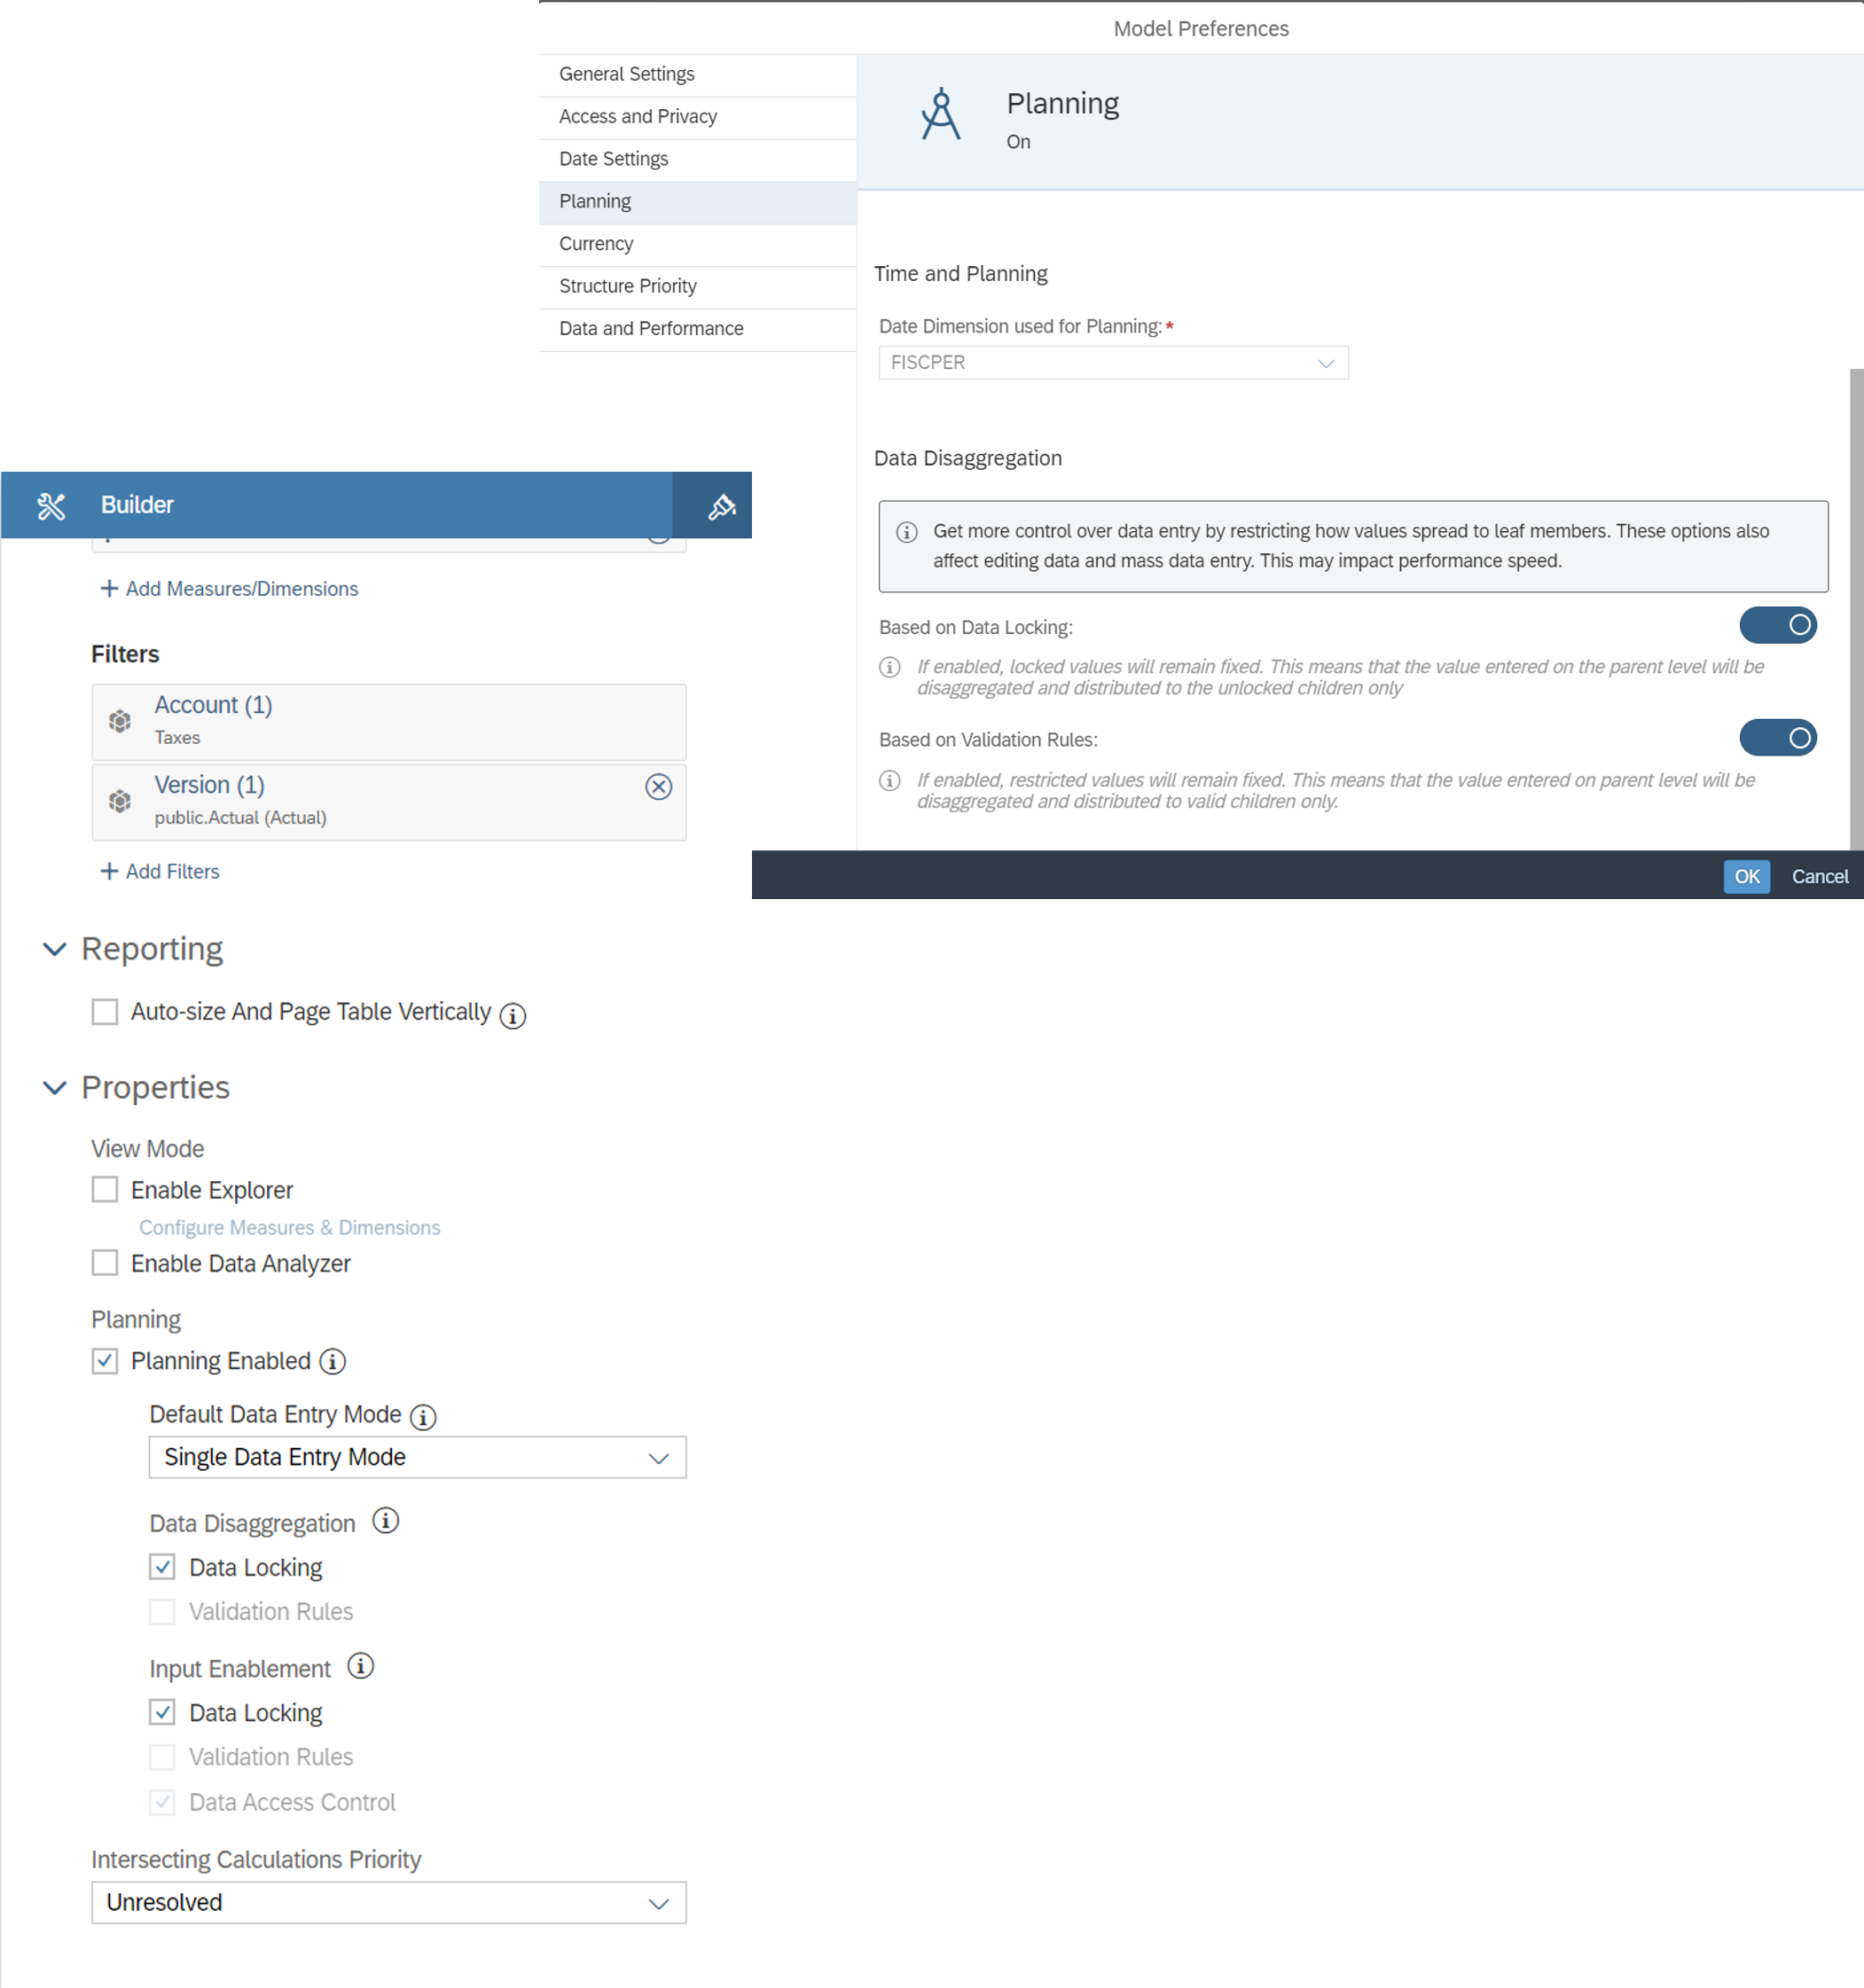
Users can now control how data is disaggregated, using the data disaggregation settings in the model preferences. Data Entry, Delete and Copy & Paste respect the data locks defined on the model. If you choose to disaggregate data based on data locks, locked child members will not receive values from parent members during planning If you choose to disaggregate data based on validation rules, invalid member combinations will not receive values during planning. Data locking-aware disaggregation can be enabled in the modeler or specifically for each table widget in a story.
Version Size and Record Visibility
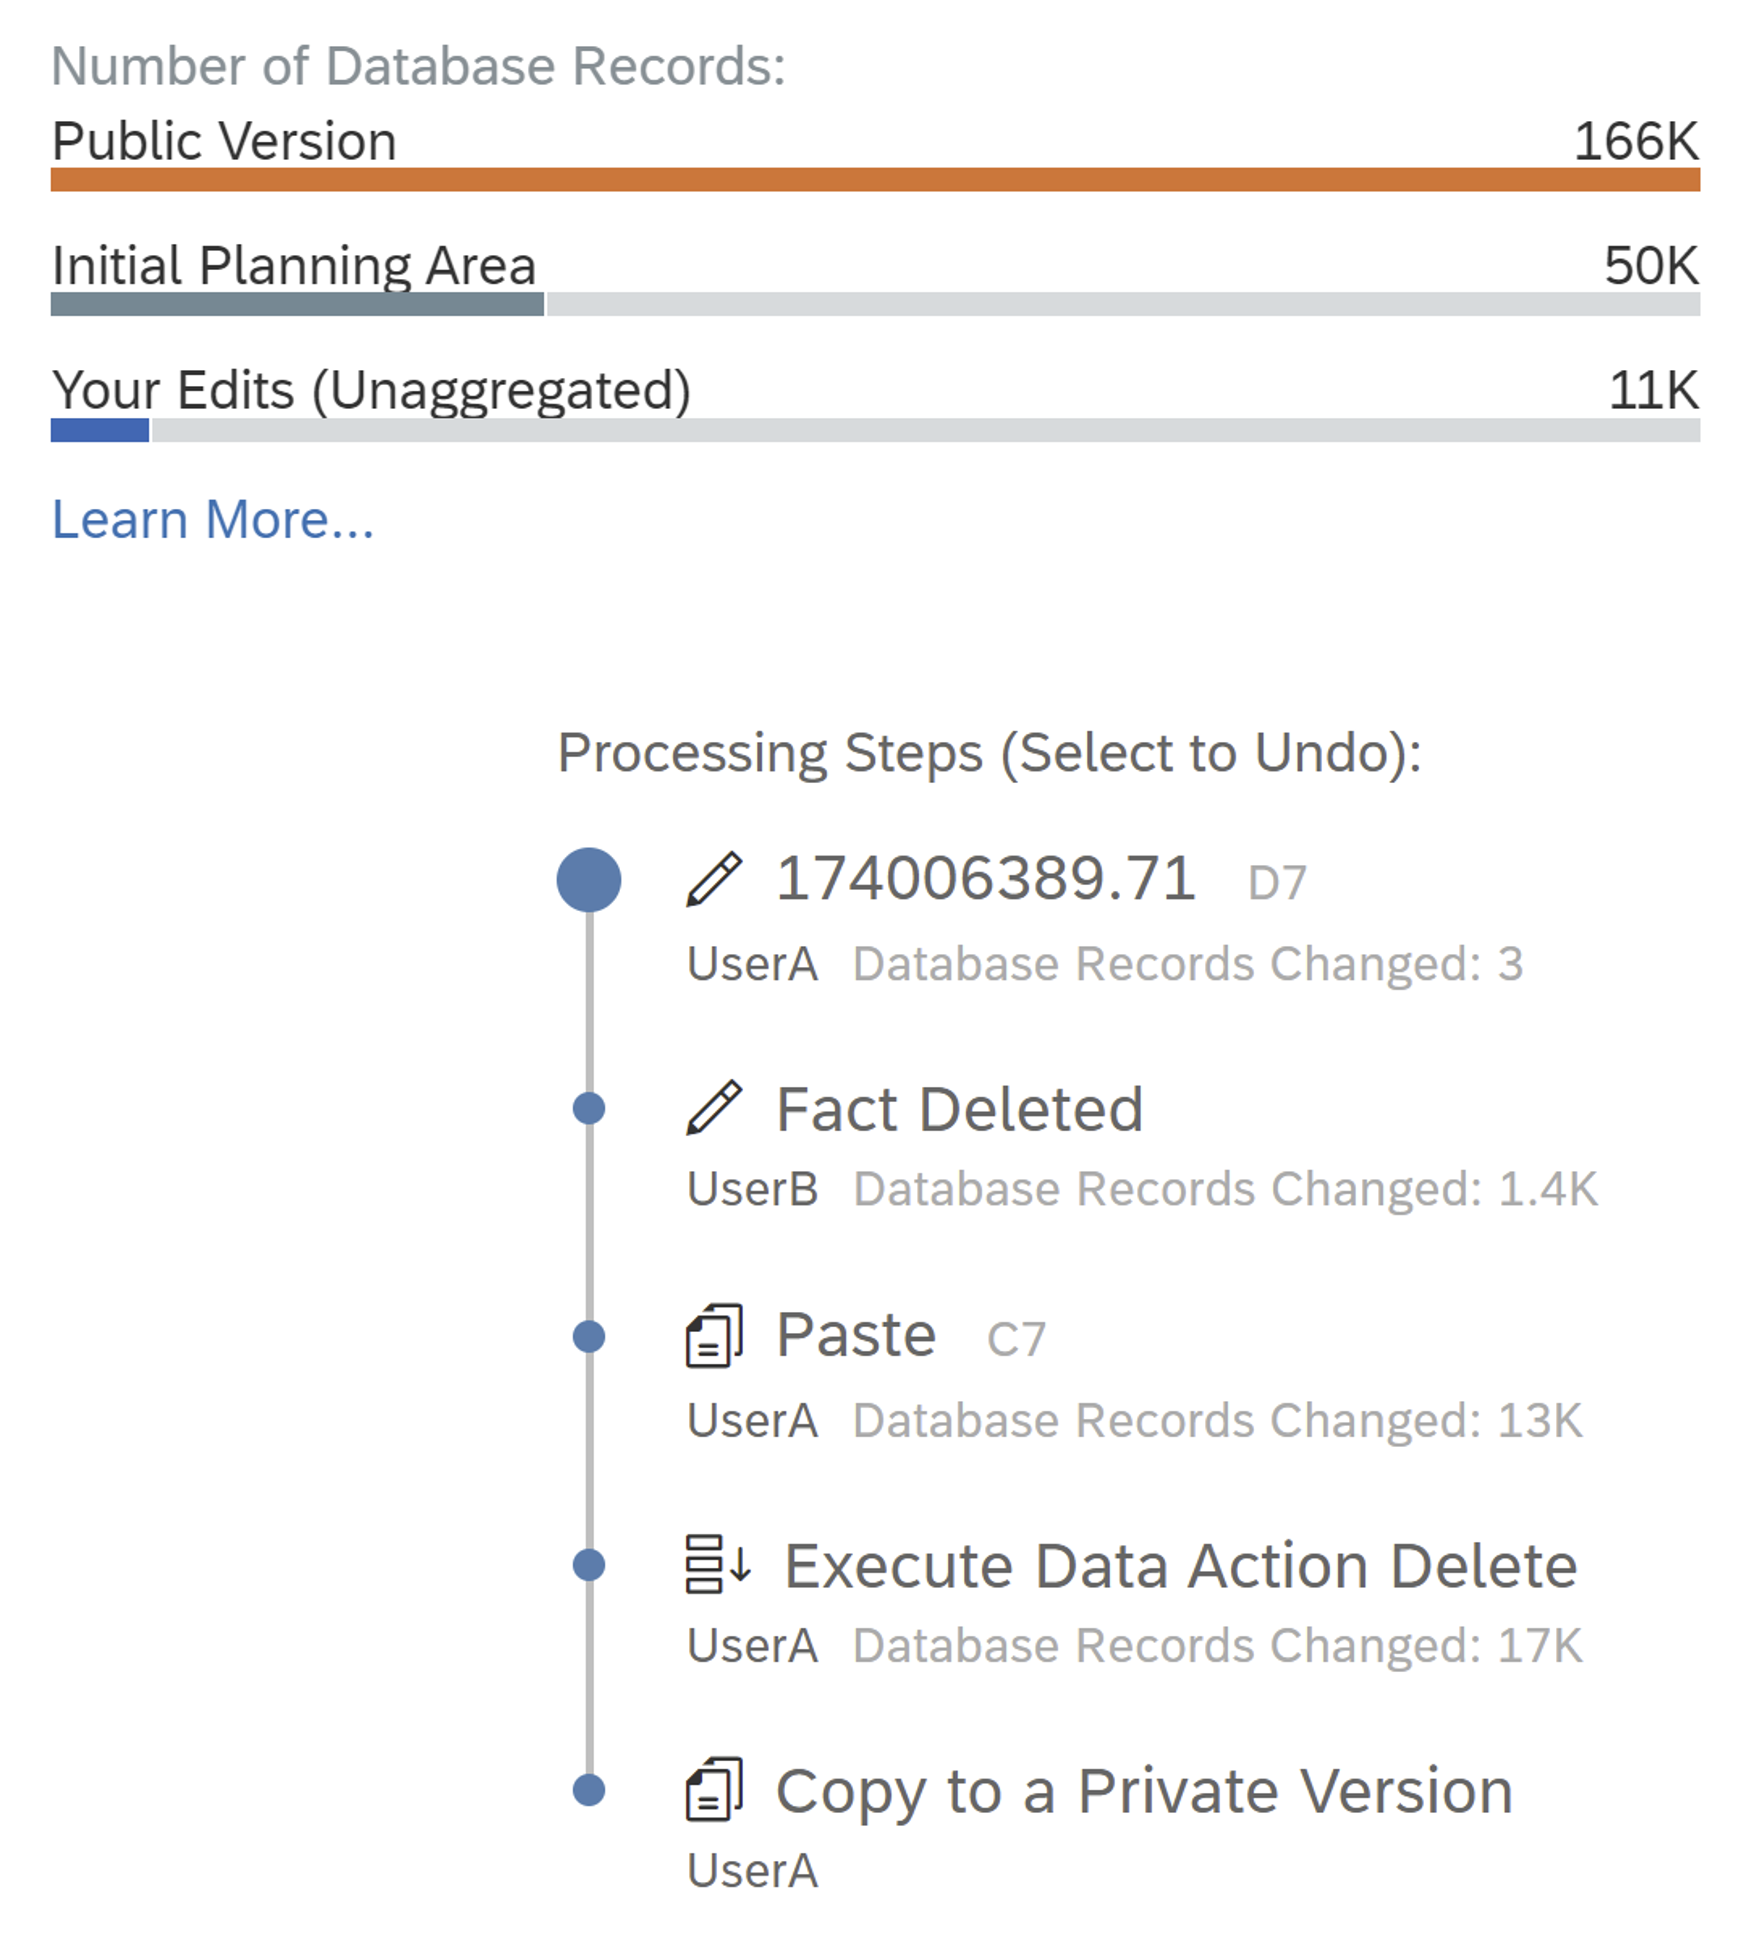
Detailed statistics for planning operations and version size are now exposed to users. The version history panel also showcases the number of changed records for each step. These statistics provide users with a better understanding of planning model optimization and shows a benefit of setting a planning area.
Fluid Data Entry
Fluid Data Entry (FDE) provides a faster and smoother experience during planned data entry. Multiple data entries can be entered sequentially and will be processed as one batch. This prevents freezing of tables during value input, and users don’t need to wait for the system to update between every entry.

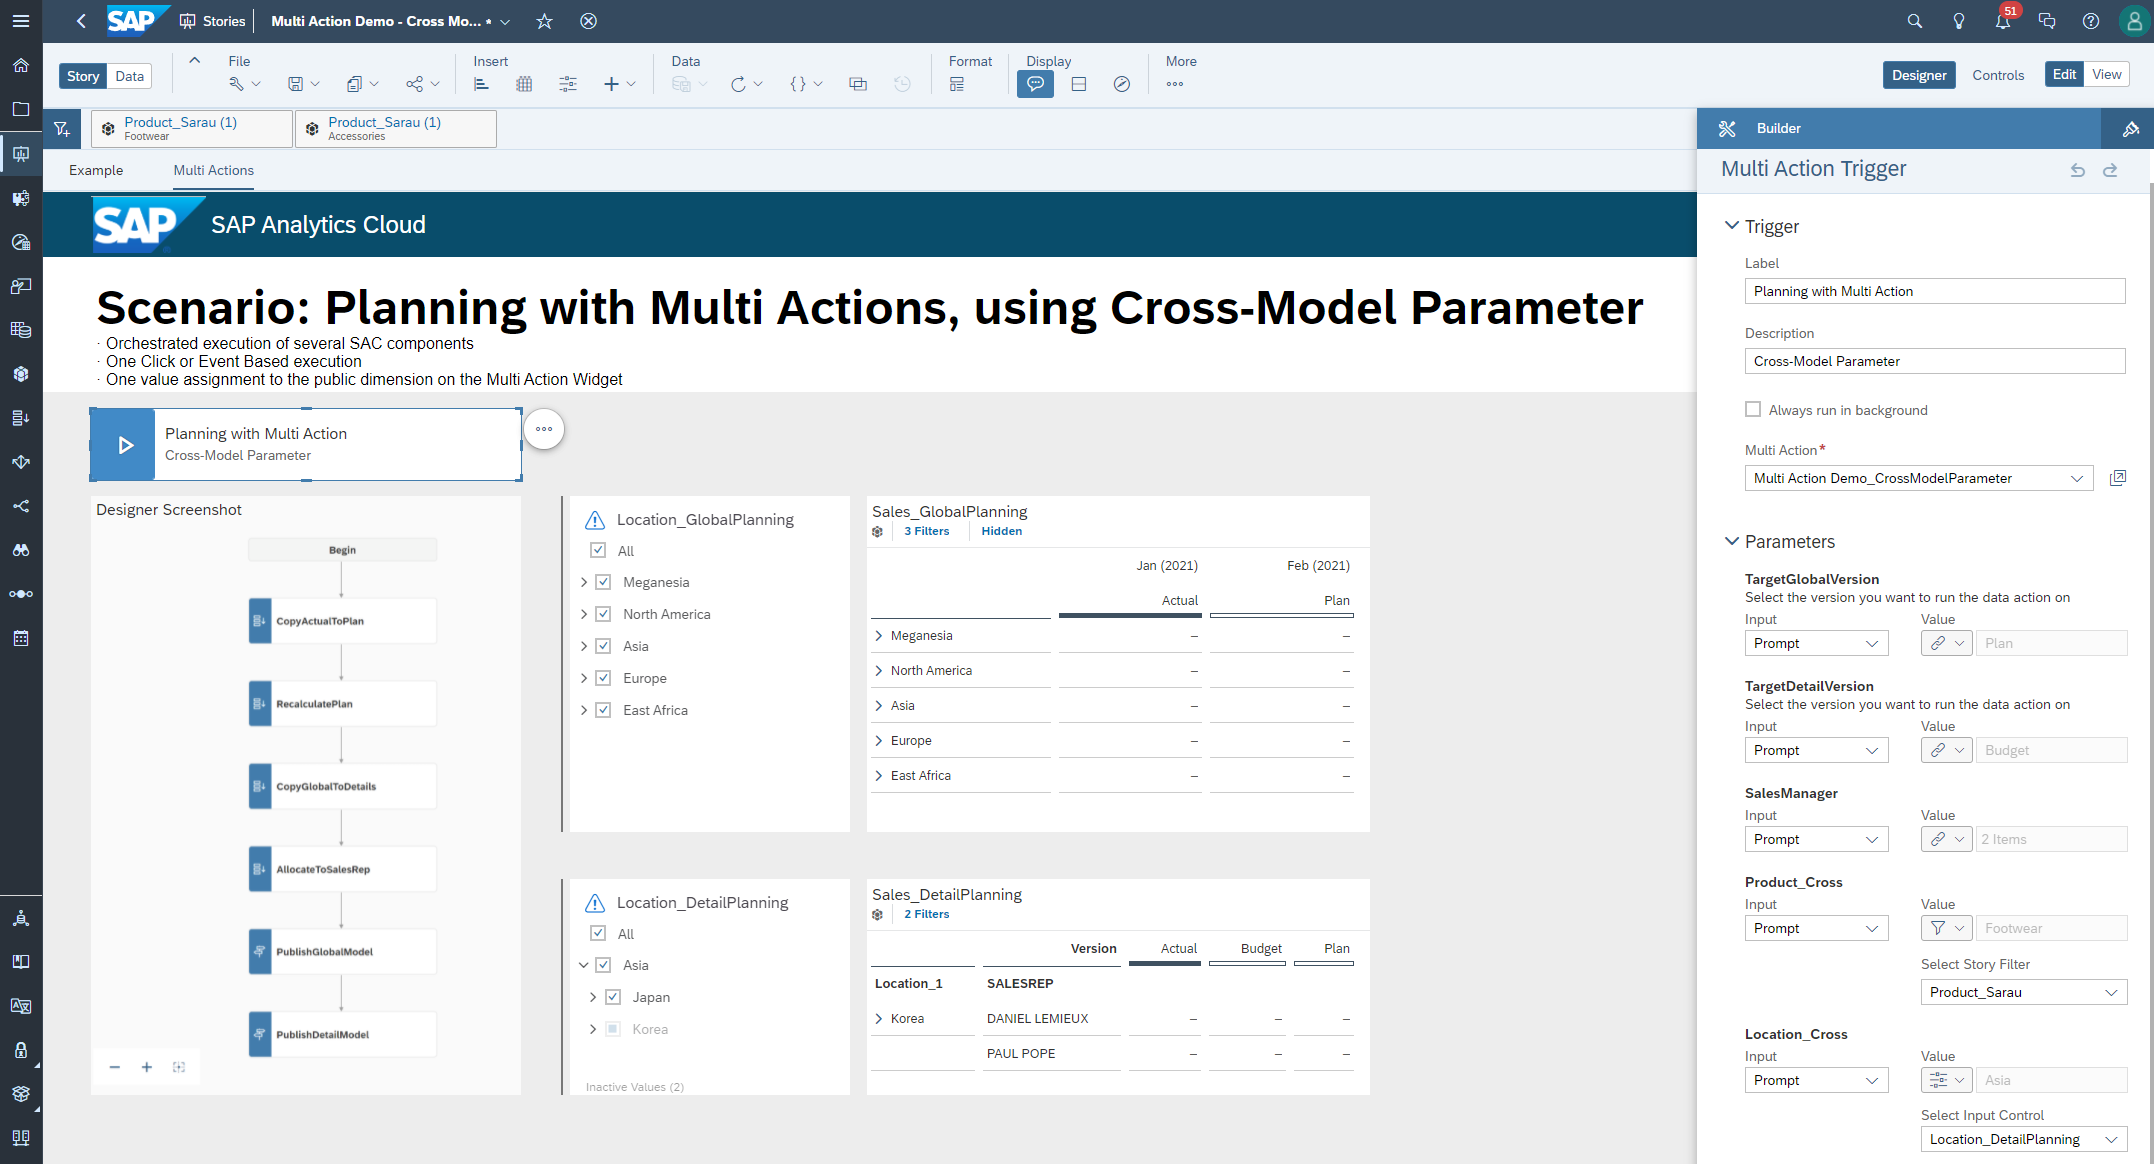
Public Dimension Parameter
Multi action parameters defined against a public dimension can now be used across different models. The cross-model parameter can be used across models and steps within the same multi action designer. In the story designer, users can either choose member selection or link the filters to assign a value to the cross-model parameter. A value only needs to be assigned once and then it can be passed to steps across models, simplifying the workflow for a planning user. This improvement makes end-user operations more convenient and less error prone.

Advanced Formulas: Support MEMBERSET filter with no equal condition
The MEMBERSET function now supports the unequal operator “!=”. Users can simplify advanced formulas and further define the scope of a member set based on this operator to exclude specific members.


Microsoft Office Integration
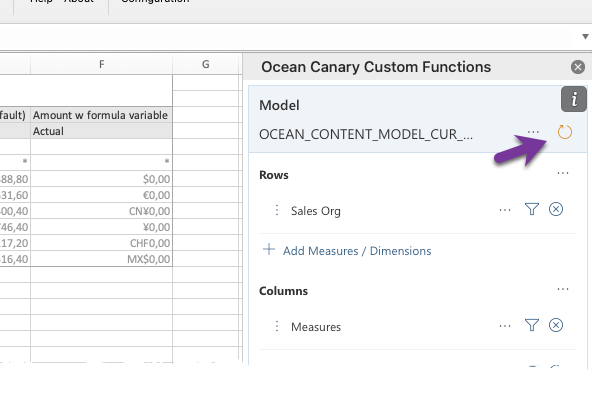
Single Table Refresh in Builder Pane and Refresh State
Users can now see all table refresh states, as well as select a single table to be refreshed in the builder pane.
- Blue = Refreshed
- Orange = Please Refresh
- Red = Unable to Refresh (eg: login not working)
Prompts (SAP Analytics Cloud Scope)
Users can use prompts to control currency, default, and non-default variables within in model. Prompts can be used for individual tables or a whole workbook.

Filter by Property in Member Selector
Users can limit the results in the member selector through setting a property filter in the task pane to restrict members. This filter can be easily switched on and off as needed.

Cell-based formulas for calling member selector
Introducing three custom functions:
- GETDIMENSIONFILTER
- Shows all filter values in the sheet and provides an option to open the member selector from the sheet
- GETDIMENSION
- Identifies all dimensions for a specific table
- GETTABLENAME
- Returns the ID of a specific table
These cell-based functions enable users with building more powerful workbooks with Excel power and easier functionality without needing to use the task pane.

This blog post only provides a high-level overview of the latest features and enhancements of SAP Analytics Cloud. You can find more details on these features in your In-App Help Guide for FastTrack customers and see this SAP Knowledge Base Article if you’d like to learn more about FastTrack and Quarterly Release Cycle releases.
If you have any questions, you can comment below or post a question to our SAP Analytics Cloud Questions & Answers forum. Visit our SAP Analytics Cloud Community pages to find more product information, best practices, and more. And check out our SAP Road Map Explorer to see more upcoming features of SAP Analytics Cloud.
Labels:
5 Comments
You must be a registered user to add a comment. If you've already registered, sign in. Otherwise, register and sign in.
Labels in this area
-
ABAP CDS Views - CDC (Change Data Capture)
2 -
AI
1 -
Analyze Workload Data
1 -
BTP
1 -
Business and IT Integration
2 -
Business application stu
1 -
Business Technology Platform
1 -
Business Trends
1,658 -
Business Trends
93 -
CAP
1 -
cf
1 -
Cloud Foundry
1 -
Confluent
1 -
Customer COE Basics and Fundamentals
1 -
Customer COE Latest and Greatest
3 -
Customer Data Browser app
1 -
Data Analysis Tool
1 -
data migration
1 -
data transfer
1 -
Datasphere
2 -
Event Information
1,400 -
Event Information
67 -
Expert
1 -
Expert Insights
177 -
Expert Insights
301 -
General
1 -
Google cloud
1 -
Google Next'24
1 -
GraphQL
1 -
Kafka
1 -
Life at SAP
780 -
Life at SAP
13 -
Migrate your Data App
1 -
MTA
1 -
Network Performance Analysis
1 -
NodeJS
1 -
PDF
1 -
POC
1 -
Product Updates
4,577 -
Product Updates
346 -
Replication Flow
1 -
REST API
1 -
RisewithSAP
1 -
SAP BTP
1 -
SAP BTP Cloud Foundry
1 -
SAP Cloud ALM
1 -
SAP Cloud Application Programming Model
1 -
SAP Datasphere
2 -
SAP S4HANA Cloud
1 -
SAP S4HANA Migration Cockpit
1 -
Technology Updates
6,873 -
Technology Updates
430 -
Workload Fluctuations
1
Related Content
- SAP BW/4 - revamp and true to the line 2024 in Technology Blogs by Members
- SAP Fiori for SAP S/4HANA - Empowering Your Homepage: Enabling My Home for SAP S/4HANA 2023 FPS01 in Technology Blogs by SAP
- Composite Data Source Configuration in Optimized Story Experience in Technology Blogs by SAP
- Top Picks: Innovations Highlights from SAP Business Technology Platform (Q1/2024) in Technology Blogs by SAP
- What’s New in SAP Analytics Cloud Release 2024.08 in Technology Blogs by SAP
Top kudoed authors
| User | Count |
|---|---|
| 29 | |
| 17 | |
| 15 | |
| 13 | |
| 11 | |
| 9 | |
| 8 | |
| 8 | |
| 8 | |
| 7 |