- SAP Community
- Products and Technology
- Technology
- Technology Blogs by SAP
- Test Reporting with the new Test Suite Dashboard
- Subscribe to RSS Feed
- Mark as New
- Mark as Read
- Bookmark
- Subscribe
- Printer Friendly Page
- Report Inappropriate Content
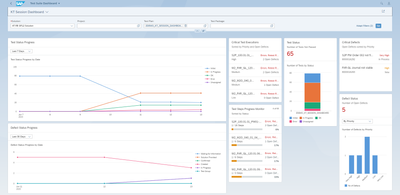
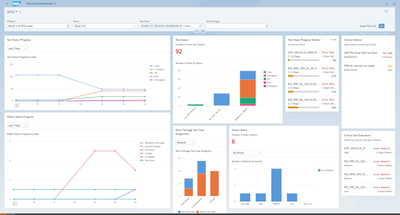
The Test Suite Dashboard is an analytical dashboard based on SAP Fiori elements to monitor the status of various testing phases. In this blog post, I will describe the test reporting with the new Test Suite Dashboard (ST-OST SP12) in more detail. Therefore, I will explain the various display options of the dashboard and present overview reports as well as reports for test execution and defect handling. In addition, I will also share further tips and tricks for the use of the new Test Suite Dashboard.
The Test Suite Dashboard is available in two modes in the SAP Solution Manager Launchpad:
- Test Suite mode
- Focused Build mode
Further information about the two modes can be found on the following blog post from Vasundhra Mahajan: https://blogs.sap.com/2022/08/17/understanding-the-new-test-suite-dashboard
Test managers can use the dashboard for test preparation, test execution and defect status relevant monitoring.
In the filter bar you can select more than one Test Plan for reporting. As the dashboard allows filtering for several Test Plans, to be able to report on Defects and Test Executions result across several plans. The main benefits of this filtering for Test Plans are the all-in-one view and monitoring of several test plans.
Another great feature of the Test Suite Dashboard is the selection and adjustment options of different cards. The dashboard includes seven cards:
- Test Status
- Test Status Progress
- Defect Status
- Defect Status Progress
- Critical Test Executions
- Critical Defects
- Test Steps Progress Monitor
These cards are resizable and can be repositioned as needed. Based on the selections made in the filter bar, indicates the contents of the cards. You have also the option to manage your cards. This option in the Test suite Dashboard leads to an improved user experience and more flexibility in reporting.
Furthermore, a view of the Test Suite Dashboard can be saved as a variant, saved as a tile, or send as an email. Please refer to the following blog post from Vasundhra Mahajan on how to manage the cards and save variants, adapt filters etc.: https://blogs.sap.com/2022/08/22/test-suite-dashboard-overview-page/
Test Execution – Test Status
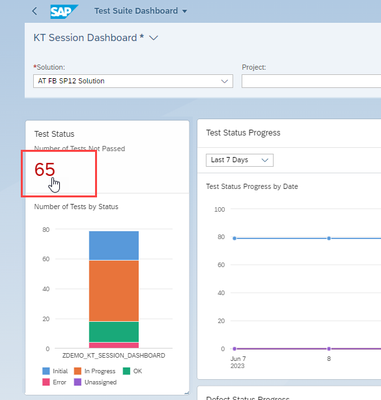
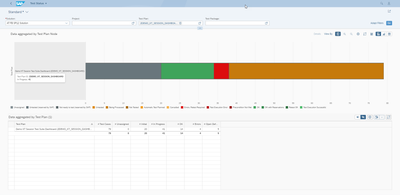
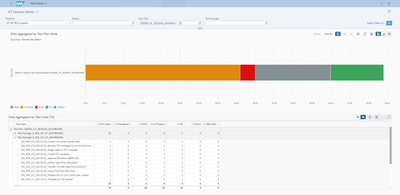
You can be forwarded to the detailed view of the Test Status by clicking on the “Number of Not Passed” (e.g., 65). From here you also the option to customize the view according to the desired information.
In the view setting you can select the relevant columns and adjust the table view by grouping (e.g., test plan, test package and test case à see screenshot). The grouping enables the information to be collected and visualized clearly.
Defect Handling
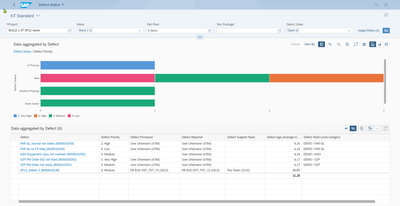
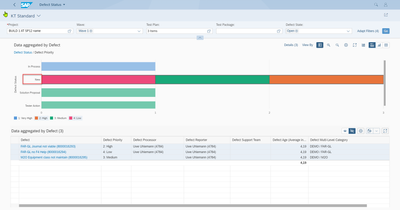
For the Defect Handling you also have options to customize and rearrange the view. From the Test Suite Dashboard, you will be forwarded to the Defect Status (detailed view) by clicking on the card Defect Status. One great feature is the usage of interactive selections. The data in the dashboard reacts immediately by selecting an option, for example ‘New’ from the defect status chart (see screenshot).
|
It is also possible to adjust the chart types for the defect handling (for example you can also select a pie chart instead of a bar chart to display the defects priority. So, you can select what you need and what you want to see.
Another feature is that you can also select/create a view where you can see the defects with Substreams by adding the category of the defects in the view settings (see screenshot):
If you want to use these categories, you must prepare the categorization schema in the customizing before you start with the test (for example see screenshot below). It is also possible to use other options for categories such as locations, type of errors etc.
You can find further information about the detailed pages of cards on the following blog post from Vasundhra Mahajan: https://blogs.sap.com/2022/08/24/focused-build-test-suite-dashboard-detail-pages/
Tips and what to consider beforehand:
- Invest time before the start of the test or in the test strategy phase
WS for all requirements needs 4-8 hours - Define exactly what is to be evaluated and according to which criteria:
- Countries, locations, sub-projects
- Processes, scenarios, topics
- Priorities, status values
- Attention: The test execution has only 2-3 usable indicators/filter options – Example
- Test plan per country
- Test package - name starts with subproject
- In the case of defects, the naming is important, but is not suitable for differentiation
- It is better to create categories in such a way that they can be easily use for filters
General Tips and Tricks:
- Define certain views and filter selections as public and make them available to everyone
- Define exactly what goal of this report page is (status meeting as overview, detail meeting, etc.)
- Do not create too complex evaluations, it is better to split them into several separate evaluations (e.g., Priority + country or Status + subproject(stream))
- Use grouping and interactive filters in meetings (select criteria during a meeting)
- Do not overload information (e.g., include too many subdivisions in one graphic)
Hint: With SP 13, two further practical functions for the Test Suite Dashboard are added:
- New Customizing activity: The activity Define Custom Fields for Analytical List Pages enableds the addtion of custom fields in the detail pages of the Test Suite Dashboard tabs, allowing to use them as entities in charts and tables, as well as filter cirteria.
- Semantic coloring: In the Status Definition tab of Administration - Test Suite, you can set valdiation colors (e.g., red of Error, green for OK). These colors can be applied in the Test Suite Dashboard for semantic coloring to classify your data.
Summary
In this blog post I gave a first overview on the test reporting with the new test suite dashboard.
With the new Test Suite Dashboard, you have several options to monitor the test status, defect status etc. By adding filters and adjust the cards for your desired outcome, you can report on the relevant information, for example create a view or tile for daily or management meetings. The new Test Suite Dashboard provides improved user experience and more flexibility in reporting.
For the usage of the new Test Suite Dashboard keep in mind to define exactly the goal of reporting and keep it simple with the defined views and filter selections.
Thank you for reading and I am happy to receive your feedback, questions, or suggestions!
You must be a registered user to add a comment. If you've already registered, sign in. Otherwise, register and sign in.
-
ABAP CDS Views - CDC (Change Data Capture)
2 -
AI
1 -
Analyze Workload Data
1 -
BTP
1 -
Business and IT Integration
2 -
Business application stu
1 -
Business Technology Platform
1 -
Business Trends
1,658 -
Business Trends
93 -
CAP
1 -
cf
1 -
Cloud Foundry
1 -
Confluent
1 -
Customer COE Basics and Fundamentals
1 -
Customer COE Latest and Greatest
3 -
Customer Data Browser app
1 -
Data Analysis Tool
1 -
data migration
1 -
data transfer
1 -
Datasphere
2 -
Event Information
1,400 -
Event Information
67 -
Expert
1 -
Expert Insights
177 -
Expert Insights
301 -
General
1 -
Google cloud
1 -
Google Next'24
1 -
GraphQL
1 -
Kafka
1 -
Life at SAP
780 -
Life at SAP
13 -
Migrate your Data App
1 -
MTA
1 -
Network Performance Analysis
1 -
NodeJS
1 -
PDF
1 -
POC
1 -
Product Updates
4,577 -
Product Updates
346 -
Replication Flow
1 -
REST API
1 -
RisewithSAP
1 -
SAP BTP
1 -
SAP BTP Cloud Foundry
1 -
SAP Cloud ALM
1 -
SAP Cloud Application Programming Model
1 -
SAP Datasphere
2 -
SAP S4HANA Cloud
1 -
SAP S4HANA Migration Cockpit
1 -
Technology Updates
6,873 -
Technology Updates
430 -
Workload Fluctuations
1
- Extend Your Crystal Reports Solutions in the DHTML Viewer With a Free Function Library in Technology Blogs by Members
- Hack2Build on Business AI – Highlighted Use Cases in Technology Blogs by SAP
- Native HANA Information Views on Source system S4/HANA. in Technology Q&A
- Horizon Theme and Templates for Stories in SAP Analytics Cloud in Technology Blogs by SAP
- Leverage Data Export Service to Visualize Data Change Log in Technology Blogs by SAP
| User | Count |
|---|---|
| 28 | |
| 17 | |
| 15 | |
| 13 | |
| 11 | |
| 9 | |
| 8 | |
| 8 | |
| 8 | |
| 7 |
