
- SAP Community
- Products and Technology
- Technology
- Technology Blogs by SAP
- KPI Status Card and KPI Status Detail Analytical L...
Technology Blogs by SAP
Learn how to extend and personalize SAP applications. Follow the SAP technology blog for insights into SAP BTP, ABAP, SAP Analytics Cloud, SAP HANA, and more.
Turn on suggestions
Auto-suggest helps you quickly narrow down your search results by suggesting possible matches as you type.
Showing results for
krithika_shanka
Explorer
Options
- Subscribe to RSS Feed
- Mark as New
- Mark as Read
- Bookmark
- Subscribe
- Printer Friendly Page
- Report Inappropriate Content
08-01-2023
4:05 AM
Introduction
This blog is part of the blogs series for the new Solution readiness dashboard delivered as part of Focused Build SP12 delivery. In this blog, we will get an overview of the KPI Status for Work Packages and Work Items and the corresponding details pages for the same.
Pre-requisite
Please go through the following blogs:
Initial Set up and Pre-requisites
What is Solution Readiness Dashboard and Brief Overview on Cards
Customization is required and users can execute the KPI framework as below. Document specific KPIs for Work Packages and Work Items are maintained here. The help section in the customization provides more details of the same.

Status Group: KPI Framework
KPI Status: By Work Package Card
In this card, we can see the KPI relevant analytical card from the documentation perspective. The standard KPI for Work Packages like Functional Specification Availability and Test Case Availability are represented across the various ratings as Completed, To be done, Milestone Missing and Overdue.

KPI Status: By Work Package Card
Functional Specification Availability: It shows the percentage of functional specification as per the status and due date from milestone.
Functional Specification Availability Completed: Lists all the work packages for which the functional specification is already in “Released” status
Functional Specification Availability To be done: Lists all the work packages which didn’t reach milestone “Functional Specification Released” and do not have functional specification assigned or is in lower status than released,
Functional Specification Availability Milestone Missing: Lists all the work packages where the milestone “Fctional Specification Released” is not provided.
Functional Specification Availability Overdue: Lists all the work packages which reached milestone date but have no Functional Specification assigned or the Functional Specification is on status lower than released
Test case Availability: It shows the percentage of Test Cases according to Work Package status and KPI due date. The KPI considers whether a Single Functional Test Case with the correct document type and expected status has been assigned to a Work Package.
Test case Availability “Completed”: Lists all the Work Packages for which the Single Functional Test Case is on status “Released”.
Test case Availability To be Done: Lists all the Work Packages which didn’t reach the milestone “Build finished” and have no Test Case assigned or the Test Case is on status lower than “Released”.
Test case Availability Milestone missing: Lists all the Work Packages where the milestone “Build finished” is not assigned.
Test case Availability Overdue: Lists all the Work Packages which reached the milestone “Build finished” date but have no Test Case assigned or the assigned Test Case is on status lower than expected.
Navigation to KPI Status for Work Packages Details: Header of the card has navigation enabled to the KPI Status for Work Packages

KPI Status for Work Package Details
KPI Status for Work Packages Analytical List Page
This provides a better insight for analyzing the KPI and KPI rating in detail. It provides a visual representation of the chart and table.
Please refer to the Smart Chart and Smart Table documentation to understand in detail how these controls behave.
For the general features, refer to the following section in Requirement blog. [Link to be provided after publishing].
The filters are carried forward from the overview pages and if required, users can also apply their own filters on the below fields available in the Adapt Filter section.
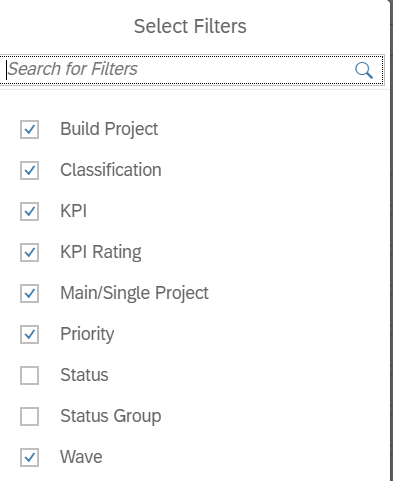
Select Filters
For example, user can choose any of the above field here for filtering and then can apply the filters by clicking on Go button to further reflect these changes for analyzing on the chart or table view.
Users can navigate further to My Work Package application, by clicking on Work Package ID field in the Table view to get more insights into the details of the Work Packages.
By choosing multiple work packages, users can also navigation to Mass change application with the corresponding work packages chosen for further performing an action on the list of work packages.
Chart Configurations
| Default Dimensions | KPI, KPI Rating |
| Default Measures | Number of Work Packages |
| Default Chart Type | Stacked Bar Chart |
| Default Sort | Work Package ID (Descending Order) |
Table Configurations
| Default Columns | Work Package ID, Work Package Title, Status, KPI Rating, KPI, Classification, Priority, Main Project, Work Package Owner, Work Item ID, Defect Correction ID |
| Sort | Work Package ID (Descending Order) |
| Group | None |
KPI Status: By Work Item Card
In this card, we can see the KPI relevant analytical card from the documentation perspective. The standard KPI for Work Items like Technical Specification Availability and Training Materia Availability are represented across the various ratings as Completed, To be done, Milestone Missing and Overdue.

KPI Status: By Work Item Card
Technical specification availability: It shows the percentage of Technical Design according to status and due date. The KPI checks if a Technical Design document with the correct document type and expected status has been assigned to a Work Item.
Technical specification availability Completed: Technical Design document on status “Released” has been assigned to Work Item. The Work Item status is “In Development” or higher.
Technical specification availability To be Done: List all Work Items which didn’t reach the due date for these Technical Designs milestone and have no Technical Design document assigned or the Technical Design document is on status lower than “Released”.
Technical specification availability Milestone missing: List all the Work Items where the milestone Technical Design Released is not maintained.
Technical specification availability Overdue: Lists all the Work Items which exceeded the due date for these Technical Designs milestone and have no Technical Design document assigned or the Technical Design document is on status lower than “Released”.
Navigation to KPI Status for Work Item Details: Header of the card has navigation enabled to the KPI Status for Work Items

KPI Status for Work Item Details
KPI Status for Work Items Analytical List Page
This provides a better insight for analyzing the KPI and KPI rating in detail. It provides a visual representation of the chart and table.
Please refer to the Smart Chart and Smart Table documentation to understand in detail how these controls behave.
For the general features, refer to the following section in Requirement blog. [Link to be provided after publishing].
The filters are carried forward from the overview pages and if required, users can also apply their own filters on the below fields available in the Adapt Filter section.

Select Filters
For example, user can choose any of the above field here for filtering and then can apply the filters by clicking on Go button to further reflect these changes for analyzing on the chart or table view.
Users can navigate further to My Work Item application, by clicking on Work Item ID field in the Table view to get more insights into the details of the Work Items.
By choosing multiple work items, users can also navigation to Mass change application with the corresponding work items chosen for further performing an action on the list of work items.
Chart Configurations
| Default Dimensions | KPI, KPI Rating |
| Default Measures | Number of Work Items |
| Default Chart Type | Stacked Bar Chart |
| Default Sort | Work Item ID (Descending Order) |
Table Configurations
| Default Columns | Work Item ID, Work Item Title, Status, KPI Rating, KPI, Classification, Priority, Build Project, Related WP |
| Sort | Work Item ID (Descending Order) |
| Group | None |
Key Takeaways
- Detail pages have a filter bar, a chart, and a table view.
- The content of chart and table is based on selections made in filter bar.
- The default chart and table configurations can also be adjusted by user as per their need
- More filtering options can be added by using the “Adapt Filter” feature.
- Users can create and save views using the variant management feature of the dashboard.
Please feel free to provide feedback either directly here in the comment section or, in case of questions, you can submit them here. You are also encouraged to follow SAP Solution Manager tag here and Focused Build for SAP Solution Manager tag here.
Important Links and Resources
- Usage Rights
- SP12 delta presentation to get an overview of the changes and read the highlights blog
- Read how SAP Activate and Focused Build with SAP Solution Manager is working together
- ALM Community page
- SAP Managed Tags:
- SAP Solution Manager,
- Focused Build for SAP Solution Manager
Labels:
You must be a registered user to add a comment. If you've already registered, sign in. Otherwise, register and sign in.
Labels in this area
-
ABAP CDS Views - CDC (Change Data Capture)
2 -
AI
1 -
Analyze Workload Data
1 -
BTP
1 -
Business and IT Integration
2 -
Business application stu
1 -
Business Technology Platform
1 -
Business Trends
1,658 -
Business Trends
95 -
CAP
1 -
cf
1 -
Cloud Foundry
1 -
Confluent
1 -
Customer COE Basics and Fundamentals
1 -
Customer COE Latest and Greatest
3 -
Customer Data Browser app
1 -
Data Analysis Tool
1 -
data migration
1 -
data transfer
1 -
Datasphere
2 -
Event Information
1,400 -
Event Information
68 -
Expert
1 -
Expert Insights
177 -
Expert Insights
311 -
General
1 -
Google cloud
1 -
Google Next'24
1 -
GraphQL
1 -
Kafka
1 -
Life at SAP
780 -
Life at SAP
13 -
Migrate your Data App
1 -
MTA
1 -
Network Performance Analysis
1 -
NodeJS
1 -
PDF
1 -
POC
1 -
Product Updates
4,576 -
Product Updates
355 -
Replication Flow
1 -
REST API
1 -
RisewithSAP
1 -
SAP BTP
1 -
SAP BTP Cloud Foundry
1 -
SAP Cloud ALM
1 -
SAP Cloud Application Programming Model
1 -
SAP Datasphere
2 -
SAP S4HANA Cloud
1 -
SAP S4HANA Migration Cockpit
1 -
Technology Updates
6,873 -
Technology Updates
444 -
Workload Fluctuations
1
Related Content
- Experience the new Product Maintenance reporting in SAP for Me / Customer Insights dashboard in Technology Blogs by SAP
- The 2024 Developer Insights Survey: The Report in Technology Blogs by SAP
- What’s New in SAP Datasphere Version 2024.9 — Apr 23, 2024 in Technology Blogs by Members
- Extract blob data (PDF) from CAPM using python library of Document information extraction service. in Technology Blogs by Members
- Deploy failed. Detail: Request failed with status code 500 in Technology Q&A
Top kudoed authors
| User | Count |
|---|---|
| 17 | |
| 17 | |
| 12 | |
| 11 | |
| 9 | |
| 9 | |
| 8 | |
| 8 | |
| 7 | |
| 7 |