
- SAP Community
- Products and Technology
- Technology
- Technology Blogs by SAP
- Deep Dive: Footprint Analytics in SAP Sustainabili...
Technology Blogs by SAP
Learn how to extend and personalize SAP applications. Follow the SAP technology blog for insights into SAP BTP, ABAP, SAP Analytics Cloud, SAP HANA, and more.
Turn on suggestions
Auto-suggest helps you quickly narrow down your search results by suggesting possible matches as you type.
Showing results for
Product and Topic Expert
Options
- Subscribe to RSS Feed
- Mark as New
- Mark as Read
- Bookmark
- Subscribe
- Printer Friendly Page
- Report Inappropriate Content
06-22-2023
1:19 PM
This blog post continues my blog series on the main product capabilities of SAP Sustainability Footprint Management. After importing business data, mapping to emission factors, and finally calculating footprints, this edition describes how you can analyze the calculated footprints for gaining new insights. I’m covering:
If you are not yet familiar with the application, I recommend you start reading my blog post Introducing Carbon Accounting with SAP Sustainability Footprint Management here in the SAP Community first.
For analyzing your calculated footprints and gaining valuable insights, SAP Sustainability Footprint Management provides many different built-in dashboards. Those are automatically loaded with data and offer various options for drilling into the details of the results. The Footprint Overview app is the starting point into footprint analytics as it displays your corporate balance, based on all the emission and outflows in the selected period and inventory.
This overview screen further provides you with various charts, displaying the top 5 purchased and sold products and energy consumers with the highest emissions. You can also drill down into the emissions by GHG scope and scope category, as well as by energy source. A trend from the past months is available as well. Clicking on the dashboards for Corporate Balance, Purchased Goods, Sold Goods, and Energy Consumers navigates to further apps, which provide even more details and list reports. You can, for example, analyze the emissions in total and per unit from all the products you're purchasing from your suppliers:
For analyzing the calculated emissions from inbound and outbound freight transports there are also a variety of built-in reports available. The View Transport Data app offers dynamic reports and business intelligence features for carbon reporting. It generates charts and detailed reports on various KPIs, including Well-to-Wheel, Well-to-Tank, and Tank-to-Wheel emissions, as required by the GLEC Framework. You can also access data on distance, shipment volume, weight, and more. The app allows for customization by transport mode, service provider, and other dimensions. Data can be viewed monthly or yearly and downloaded for easy integration into existing reports.
Another great analytical app is View Transport Routes, which allows you to visualize and analyze all your inbound & outbound transport flows and their respective emissions on a world map. This includes the overall route high level from country to country as well as a breakdown into the transport legs and comes with many filter options, so you can focus on certain products or locations. You can also display heatmaps, which show where the chosen measure is centered, for example, where most of the emissions were emitted during transportation.
If you would like to integrate the calculated footprints into the analytical application of your choice, you can do so by leveraging the OData API available on SAP Business Accelerator Hub. This allows you to integrate sustainability into existing reports or to build your own sustainability dashboards that are fitting to your company’s need. You can do that with any analytical application, such as SAP Analytics Cloud or non-SAP solutions.
We're constantly updating the existing built-in dashboards as well as delivering new ones to provide you with even more insights. We plan to deliver simulation capabilities to simulate different footprint scenarios and run what-if analyses. This allows you modeling alternative scenarios to run a sensitivity analysis for a single product and compare the carbon footprints of different products on the platform. You can then, for example, simulate the impact of switching raw material suppliers on the manufactured product’s overall footprint. This helps you to decide on sustainable product design, production efficiency, and improved source of supply.
Further, we're planning an integration into SAP Sustainability Control Tower, providing calculated product, corporate, and value chain emissions to enable holistic steering and reporting with footprints on detailed business activities.
For an overview of all planned innovations and their benefit for you and your company, have a look into SAP Road Map Explorer.
If you are not yet familiar with the application, I recommend you start reading my blog post Introducing Carbon Accounting with SAP Sustainability Footprint Management here in the SAP Community first.
Built-In Analytics
For analyzing your calculated footprints and gaining valuable insights, SAP Sustainability Footprint Management provides many different built-in dashboards. Those are automatically loaded with data and offer various options for drilling into the details of the results. The Footprint Overview app is the starting point into footprint analytics as it displays your corporate balance, based on all the emission and outflows in the selected period and inventory.

Footprint Overview
This overview screen further provides you with various charts, displaying the top 5 purchased and sold products and energy consumers with the highest emissions. You can also drill down into the emissions by GHG scope and scope category, as well as by energy source. A trend from the past months is available as well. Clicking on the dashboards for Corporate Balance, Purchased Goods, Sold Goods, and Energy Consumers navigates to further apps, which provide even more details and list reports. You can, for example, analyze the emissions in total and per unit from all the products you're purchasing from your suppliers:
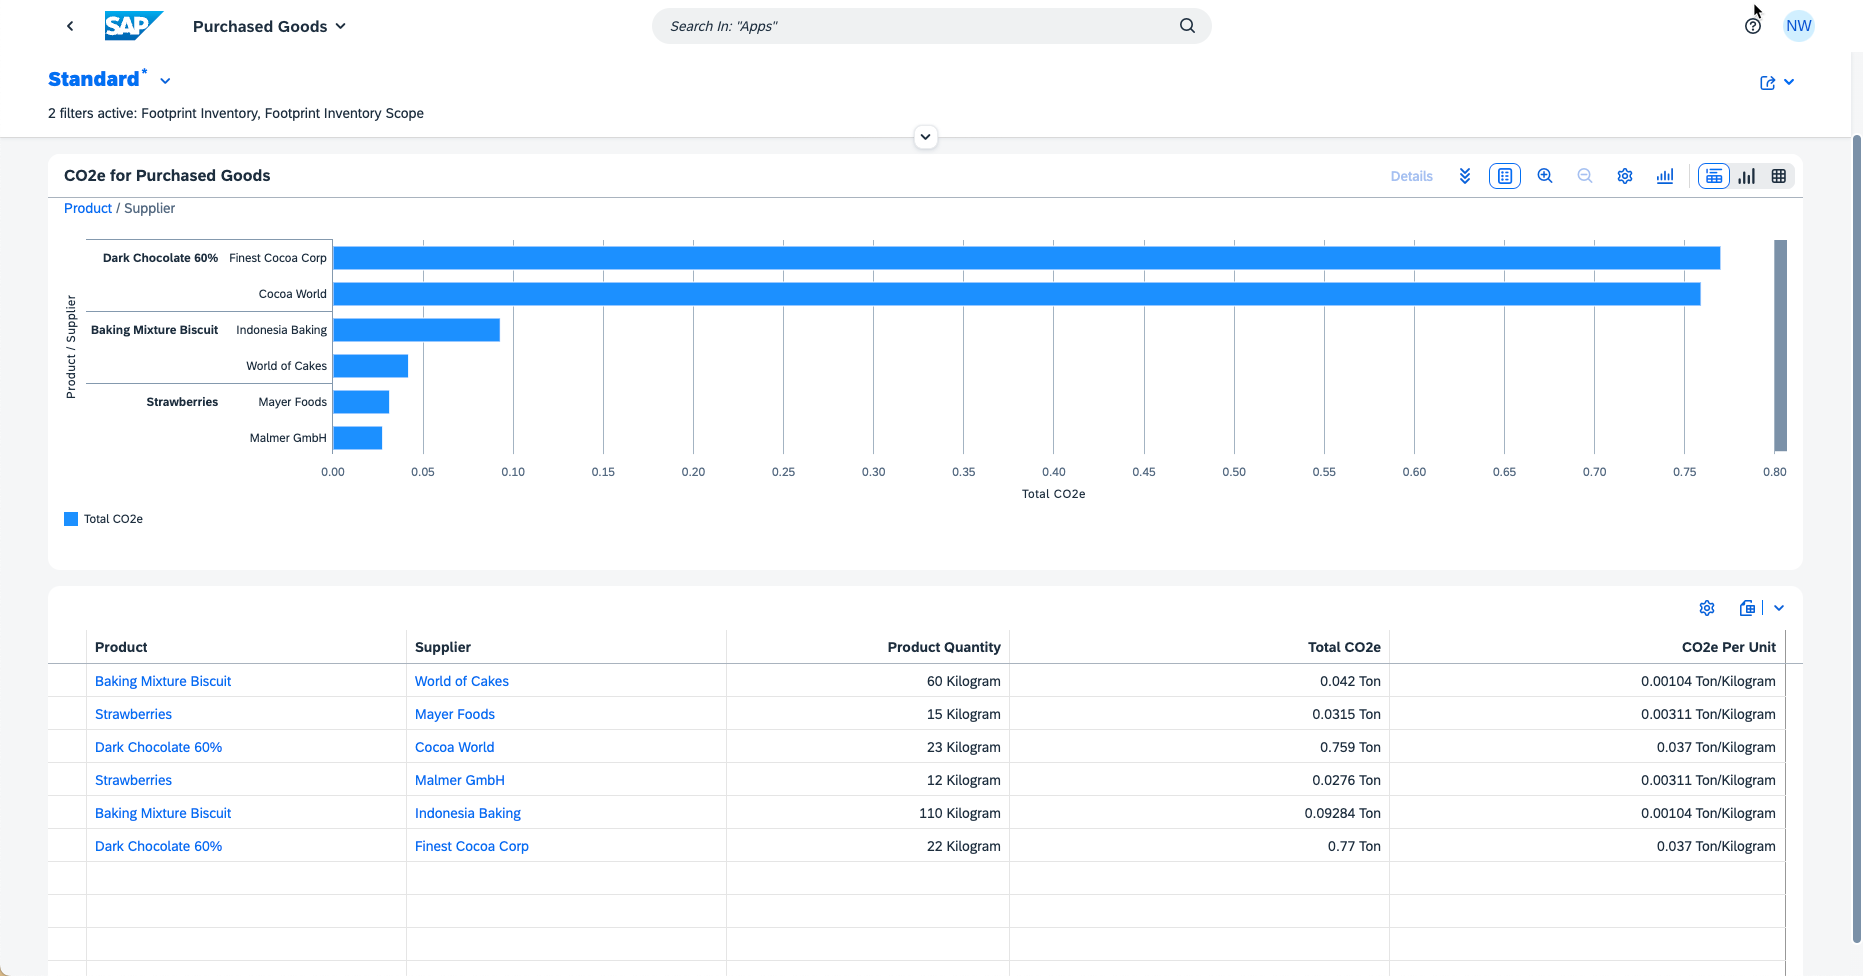
Purchased Goods Analytics
Freight Transport Analytics
For analyzing the calculated emissions from inbound and outbound freight transports there are also a variety of built-in reports available. The View Transport Data app offers dynamic reports and business intelligence features for carbon reporting. It generates charts and detailed reports on various KPIs, including Well-to-Wheel, Well-to-Tank, and Tank-to-Wheel emissions, as required by the GLEC Framework. You can also access data on distance, shipment volume, weight, and more. The app allows for customization by transport mode, service provider, and other dimensions. Data can be viewed monthly or yearly and downloaded for easy integration into existing reports.
![]()
View Transport Data
Another great analytical app is View Transport Routes, which allows you to visualize and analyze all your inbound & outbound transport flows and their respective emissions on a world map. This includes the overall route high level from country to country as well as a breakdown into the transport legs and comes with many filter options, so you can focus on certain products or locations. You can also display heatmaps, which show where the chosen measure is centered, for example, where most of the emissions were emitted during transportation.
![]()
View Transport Routes and Heatmap
Analytical API
If you would like to integrate the calculated footprints into the analytical application of your choice, you can do so by leveraging the OData API available on SAP Business Accelerator Hub. This allows you to integrate sustainability into existing reports or to build your own sustainability dashboards that are fitting to your company’s need. You can do that with any analytical application, such as SAP Analytics Cloud or non-SAP solutions.
Outlook
We're constantly updating the existing built-in dashboards as well as delivering new ones to provide you with even more insights. We plan to deliver simulation capabilities to simulate different footprint scenarios and run what-if analyses. This allows you modeling alternative scenarios to run a sensitivity analysis for a single product and compare the carbon footprints of different products on the platform. You can then, for example, simulate the impact of switching raw material suppliers on the manufactured product’s overall footprint. This helps you to decide on sustainable product design, production efficiency, and improved source of supply.
Further, we're planning an integration into SAP Sustainability Control Tower, providing calculated product, corporate, and value chain emissions to enable holistic steering and reporting with footprints on detailed business activities.
For an overview of all planned innovations and their benefit for you and your company, have a look into SAP Road Map Explorer.
- SAP Managed Tags:
- SAP S/4HANA,
- Sustainability,
- SAP S/4HANA Public Cloud,
- SAP Business Technology Platform
Labels:
3 Comments
You must be a registered user to add a comment. If you've already registered, sign in. Otherwise, register and sign in.
Labels in this area
-
ABAP CDS Views - CDC (Change Data Capture)
2 -
AI
1 -
Analyze Workload Data
1 -
BTP
1 -
Business and IT Integration
2 -
Business application stu
1 -
Business Technology Platform
1 -
Business Trends
1,658 -
Business Trends
93 -
CAP
1 -
cf
1 -
Cloud Foundry
1 -
Confluent
1 -
Customer COE Basics and Fundamentals
1 -
Customer COE Latest and Greatest
3 -
Customer Data Browser app
1 -
Data Analysis Tool
1 -
data migration
1 -
data transfer
1 -
Datasphere
2 -
Event Information
1,400 -
Event Information
67 -
Expert
1 -
Expert Insights
177 -
Expert Insights
301 -
General
1 -
Google cloud
1 -
Google Next'24
1 -
GraphQL
1 -
Kafka
1 -
Life at SAP
780 -
Life at SAP
13 -
Migrate your Data App
1 -
MTA
1 -
Network Performance Analysis
1 -
NodeJS
1 -
PDF
1 -
POC
1 -
Product Updates
4,577 -
Product Updates
346 -
Replication Flow
1 -
REST API
1 -
RisewithSAP
1 -
SAP BTP
1 -
SAP BTP Cloud Foundry
1 -
SAP Cloud ALM
1 -
SAP Cloud Application Programming Model
1 -
SAP Datasphere
2 -
SAP S4HANA Cloud
1 -
SAP S4HANA Migration Cockpit
1 -
Technology Updates
6,873 -
Technology Updates
430 -
Workload Fluctuations
1
Related Content
- It has never been easier to print from SAP with Microsoft Universal Print in Technology Blogs by Members
- Partner-2-Partner Collaboration in Manufacturing in Technology Blogs by SAP
- SAP Sustainability Footprint Management: Q1-24 Updates & Highlights in Technology Blogs by SAP
- Elevating Customer Engagement: Harnessing the Power of SAP Chatbots for a Personalized Experience in Technology Blogs by Members
- Digital Twins of an Organization: why worth it and why now in Technology Blogs by SAP
Top kudoed authors
| User | Count |
|---|---|
| 29 | |
| 17 | |
| 15 | |
| 13 | |
| 11 | |
| 9 | |
| 8 | |
| 8 | |
| 8 | |
| 7 |