

- SAP Community
- Products and Technology
- Technology
- Technology Blogs by SAP
- CAP with Fiori Elements: Configure Multiple Views ...
Technology Blogs by SAP
Learn how to extend and personalize SAP applications. Follow the SAP technology blog for insights into SAP BTP, ABAP, SAP Analytics Cloud, SAP HANA, and more.
Turn on suggestions
Auto-suggest helps you quickly narrow down your search results by suggesting possible matches as you type.
Showing results for
Product and Topic Expert
Options
- Subscribe to RSS Feed
- Mark as New
- Mark as Read
- Bookmark
- Subscribe
- Printer Friendly Page
- Report Inappropriate Content
12-25-2023
10:59 AM
Introduction:
Sometime back, I had the opportunity to delve into the world of Fiori Elements, documenting my understandings that highlighted some of its key features in following blog post:
CAP with Fiori Elements: Side Effects, Custom Actions, Dynamic Expressions
Building upon that exploration, in this blogpost, I aim to explain different options available for presenting table in a List Report and how can we use these features to enhance user experience when showcasing data in a tabular format.
Example of POC Scenario and Its resources:
We will use the sample project “cap-fe-lr-table-views” that I have shared on GitHub here to explain the concepts. Let's briefly examine the project and some of its essential files.
 |
|
Service “cap_fe_lr_table_views_service” proivides following data set: Orders, Order Items, Order Types, Customers, Products, ItemTotals, CustomerTotals.
Please be aware that in this blog post, my emphasis is on illustrating the functionality of presenting tables in various configurations. It's worth noting that the service utilized for demonstration purposes may not be flawless and is solely used to explain the functionalities.
Detailed Explanation:
Before diving into various combination of configurations to achieve different visualizations, it is crucial to understand following couple of things:
- Relevant Annotations
- Table Modes
1. Relevant Annotations:
- SelectionVariant – With the use of this annotation, we can provide default filters that are sent as queries for the annotated entity set. Essentially, this annotation helps in determining which data should be displayed in a view.
- PresentationVariant – With the use of this annotation, we can provide how the result/data is displayed e.g. as a Table or Chart, how the table is sorted or grouped etc.
- SelectionPresentationVariant – Combines Selection Variant and PresentationVariant.
In addition to annotations mentioned above, some configurations are also added in Application Descriptor File (manifest.json).
 |
Note: @UI.LineItem and @UI.Chart annotation are used to bring up tables and charts respectively in SAP Fiori Elements.
2.Table Modes:
- Single Table Mode: UI contains a single table instance and to switch between views, a segmented button is used.
- Multiple Table Mode: UI contains multiple table instance and a Tab bar is used to switch between views.
Now Let’s look at some examples to understand a bit more.
Scenario 1: Single Table - Segmented View
In this scenario, single insatnce of table is used to offer a segmented view. For example, within a segmented view of sales orders, one view displays return orders, while another view showcases other types of orders.
 |
To achieve above functionality following anotations and configirations are added:
/app/ui01/annotations.cdsannotate service.Orders with @(
UI.SelectionVariant #SelVarRO: {
$Type : 'UI.SelectionVariantType',
Text : 'Return Orders',
SelectOptions: [{
$Type : 'UI.SelectOptionType',
PropertyName: type.ID,
Ranges : [{
$Type : 'UI.SelectionRangeType',
Sign : #I,
Option: #EQ,
Low : 'RO'
}]
}]
},
UI.SelectionVariant #SelVarSO: {
$Type : 'UI.SelectionVariantType',
Text : 'Sales Orders',
SelectOptions: [{
$Type : 'UI.SelectOptionType',
PropertyName: type.ID,
Ranges : [{
$Type : 'UI.SelectionRangeType',
Sign : #I,
Option: #NE,
Low : 'RO'
}]
}]
}
); |
/app/ui01/webapp/manifest.json"@com.sap.vocabularies.UI.v1.LineItem": {
"tableSettings": {
"quickVariantSelection": {
"hideTableTitle": false,
"showCounts": true,
"paths": [
{"annotationPath": "com.sap.vocabularies.UI.v1.SelectionVariant#SelVarSO"},
{"annotationPath": "com.sap.vocabularies.UI.v1.SelectionVariant#SelVarRO"}
]
}
}
} |
Here we have defined two selection variants labeled as #SelVarRO and #SelVarSO using annotations. These variants incorporate select options that are essentially act as filters on the defined entityset. These are subsequently added to the table configuration under quickVariantSelection in the manifest.json file. Additionally, you have the option to specify whether each view should indicate the number of rows it displays by setting showCounts to true.
Note-1: multiple filters defined as ranges can be provided in select option.
Note-2: If you define more than three selection variants, a drop down menu will be displayed instead of segmented button.
Scenario 2: Multiple Table - Tab View
In this scenario, multiple instances of the table are employed to provide a tabbed view. If there are n views, then n instances of the table are utilized. However, only one view is rendered at a time. An icon tab is presented to facilitate switching between views. For instance, in a tab view of sales orders, one view shows return orders, while another view highlights other types of orders.
 |
To achieve above functionality following anotations and configirations are added:
/app/ui02/annotations.cdsannotate service.Orders with @(
UI.SelectionPresentationVariant #SelPreVarRO: {
$Type : 'UI.SelectionPresentationVariantType',
Text : 'Return Orders',
SelectionVariant : {
$Type : 'UI.SelectionVariantType',
Text : 'Return Orders',
SelectOptions: [{
$Type : 'UI.SelectOptionType',
PropertyName: type.ID,
Ranges : [{
$Type : 'UI.SelectionRangeType',
Sign : #I,
Option: #EQ,
Low : 'RO'
}]
}]
},
PresentationVariant: {
$Type : 'UI.PresentationVariantType',
Visualizations: ['@UI.LineItem#ROrders'],
SortOrder : [{
$Type : 'Common.SortOrderType',
Property : ID,
Descending: false
}],
GroupBy : [customer_ID]
}
},
UI.SelectionPresentationVariant #SelPreVarSO: {
$Type : 'UI.SelectionPresentationVariantType',
Text : 'Sales Orders',
SelectionVariant : {
$Type : 'UI.SelectionVariantType',
Text : 'Return Orders',
SelectOptions: [{
$Type : 'UI.SelectOptionType',
PropertyName: type.ID,
Ranges : [{
$Type : 'UI.SelectionRangeType',
Sign : #I,
Option: #NE,
Low : 'RO'
}]
}]
},
PresentationVariant: {
$Type : 'UI.PresentationVariantType',
Visualizations: ['@UI.LineItem#SOrders'],
SortOrder : [{
$Type : 'Common.SortOrderType',
Property : totalamount,
Descending: false
}],
GroupBy : [type_ID]
}
}
); |
/app/ui02/webapp/manifest.json"views": {
"paths": [
{
"key": "tab0",
"annotationPath": "com.sap.vocabularies.UI.v1.SelectionPresentationVariant#SelPreVarSO"
},
{
"key": "tab1",
"annotationPath": "com.sap.vocabularies.UI.v1.SelectionPresentationVariant#SelPreVarRO"
}
],
"showCounts": true
} |
Here we have used two selection presentation variants labeled as #SelPreVarRO and #SelPreVarSO using annotations. Each of these variants incorporates selection variant and presentation variant. Each presentation variant includes references to visualizations @UI.LineItem labeled with #SOrders and #ROrders, along with specified sort order and group-by settings. These selection presentation variants are subsequently added to the table configuration under views in the manifest.json file.
Scenario 3: Multiple Table & Chart - Tab View
This scenario is simillar to previous scenario. In this scenario, one table and one chart is displayed in a tabbed view.
 |
To achieve above functionality following anotations and configirations are added:
/app/ui03/annotations.cdsannotate service.Orders with @(
UI.SelectionPresentationVariant #SPVSOTable : {
$Type : 'UI.SelectionPresentationVariantType',
Text : 'Sales Orders (Table)',
SelectionVariant : {
$Type : 'UI.SelectionVariantType',
Text : 'Sales Orders (Table)',
SelectOptions: [{
$Type : 'UI.SelectOptionType',
PropertyName: type_ID,
Ranges : [{
$Type : 'UI.SelectionRangeType',
Sign : #I,
Option: #NE,
Low : 'RO'
} ],
} ],
},
PresentationVariant: {
$Type : 'UI.PresentationVariantType',
Visualizations: ['@UI.LineItem#SOTable']
}
},
UI.SelectionPresentationVariant #SPVROChart : {
$Type : 'UI.SelectionPresentationVariantType',
Text : 'Return Orders (Chart)',
SelectionVariant : {
$Type : 'UI.SelectionVariantType',
Text : 'Sales Orders (Table)',
SelectOptions: [{
$Type : 'UI.SelectOptionType',
PropertyName: type_ID,
Ranges : [{
$Type : 'UI.SelectionRangeType',
Sign : #I,
Option: #EQ,
Low : 'RO'
} ]
} ]
},
PresentationVariant: {
$Type : 'UI.PresentationVariantType',
Visualizations: ['@UI.Chart#ROChart']
}
}
); | |
annotate service.Orders with @(
  UI.LineItem #SOTable : [
    {
        $Type: 'UI.DataField',
        Label: 'ID',
        Value: ID
    },
    {
        $Type: 'UI.DataField',
        Label: 'Description',
        Value: descr
    },
    {
        $Type: 'UI.DataField',
        Label: 'Order Type',
        Value: type_ID
    },
    {
        $Type: 'UI.DataField',
        Label: 'Total Amount',
        Value: totalamount
    },
    {
        $Type: 'UI.DataField',
        Label: 'Customer',
        Value: customer_ID
    }
  ]
); | annotate service.Orders with @(
Analytics.AggregatedProperty #totalamount_sum: {
$Type : 'Analytics.AggregatedPropertyType',
Name : 'totalamount_sum',
AggregatableProperty: totalamount,
AggregationMethod : 'sum',
![@Common.Label] : 'totalamount (Sum)',
},
UI.Chart #ROChart : {
$Type : 'UI.ChartDefinitionType',
Title : 'Return Orders by Customers',
ChartType : #Bar,
Dimensions : [customer_ID, ],
DimensionAttributes: [{
$Type : 'UI.ChartDimensionAttributeType',
Dimension: customer_ID,
Role : #Category
}],
DynamicMeasures : [
'@Analytics.AggregatedProperty#totalamount_sum'
]
}
); |
/app/ui03/webapp/manifest.json"views": { "paths": [
{
"key": "tab0",
"annotationPath": "com.sap.vocabularies.UI.v1.SelectionPresentationVariant#SPVSOTable"
},
{
"key": "tab1",
"annotationPath": "com.sap.vocabularies.UI.v1.SelectionPresentationVariant#SPVROChart"
}
],
"showCounts": true
} |
Here one sepection presentation variant contains a chart visualization as shown above. Rest of the settings remain same.
Scenario 4: Multiple Table - Tab & Segmented View
In this scenario, we combine scenario 1 and 2, incorporating multiple tables within a tabbed view, and one of the views includes a segmented view within itself.
 |
| /app/ui04/annotations.cds Similar to the annotations explained earlier, two selection presentation variants labeled as #SPVSO and #SPVRO are defined which referrs to two tables with labels #SO and #RO respectively. Additionally, there are three selection variants defined with labels #SVSS, #SVCS, #SVRS. |
/app/ui04/webapp/manifest.json"views": {
"paths": [
{
"key": "tab0",
"annotationPath":"com.sap.vocabularies.UI.v1.SelectionPresentationVariant#SPVSO"
},
{
"key": "tab1",
"annotationPath":"com.sap.vocabularies.UI.v1.SelectionPresentationVariant#SPVRO"
}
],
"showCounts": true
},
"controlConfiguration": {
"@com.sap.vocabularies.UI.v1.LineItem#SO": { "tableSettings": {
"quickVariantSelection": {
"showCounts": true,
"paths": [
{
"annotationPath": "com.sap.vocabularies.UI.v1.SelectionVariant#SVSS"
},
{
"annotationPath": "com.sap.vocabularies.UI.v1.SelectionVariant#SVCS"
},
{
"annotationPath": "com.sap.vocabularies.UI.v1.SelectionVariant#SVRS"
}
]
}
} }
} |
Annotations are applied in same way as previous scenario. The only difference is in configurations added in manifest.json. Selection presentation variants are added in views and selection variants are added in quickVariantSelection. However, quickVariantSelection is added under the table configuration labelled as "@com.sap.vocabularies.UI.v1.LineItem#SO".
Scenario 5: Multiple Table - Multiple EntitySet
In this final scenario, all the previously mentioned scenarios are combined. Furthermore, different datasets are showcased. For instance, the first tab view displays a list of orders, the second one presents the total orders by item, and the last one exhibits order totals by customers.
 |
To achieve above functionality following anotations and configirations are added:
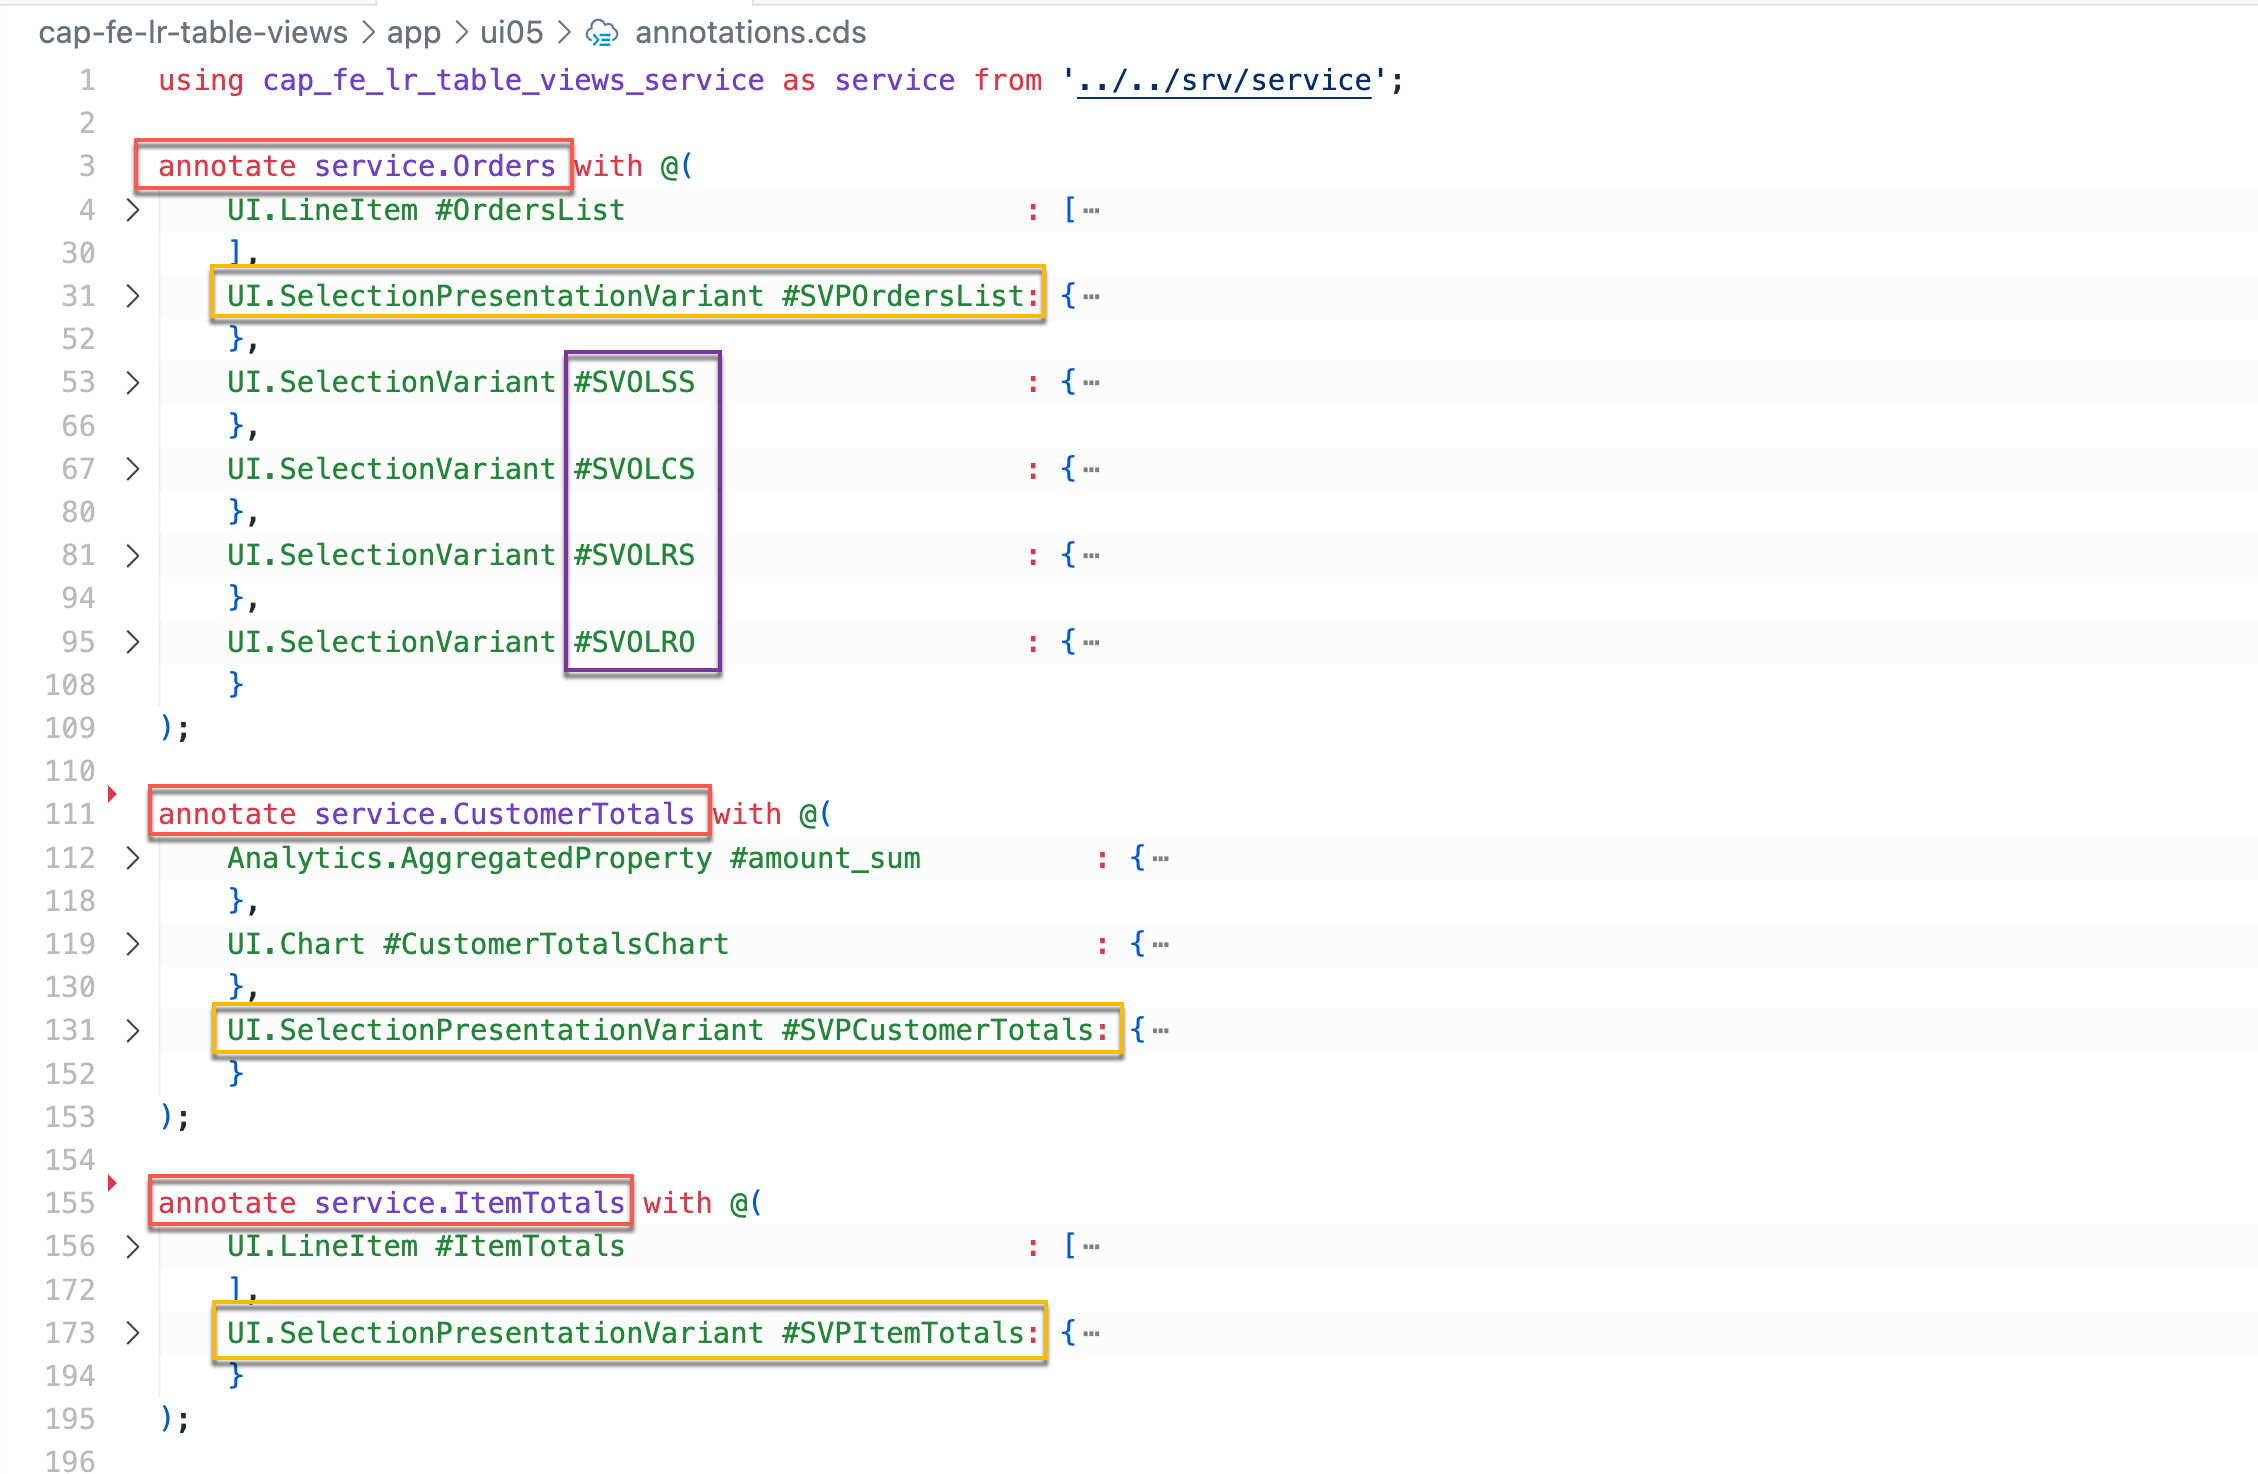
| /app/ui05/annotations.cds
|
| /app/ui05/webapp/manifest.json
|
Annotations are applied in the same manner as previously demonstrated. However, they are defined for different entity sets such as Orders, ItemTotals, and CustomerTotals. Additionally, configurations are incorporated in manifest.json. Since selection presentation variants are relevant to different datasets, the entitySet property must be specified for each variant in manifest.json (as highlighted in red).
Conclusion:
In this blog post, we have explored how various annotations and configurations can be utilized to depict diverse datasets through multiple views in a List Report.
Together, the Cloud Application Programming Model and Fiori Elements improve developer experience while also boosting productivity and accelerating the development of enterprise-ready applications.
More information about Fiori Elements with cloud application programming model can be found here. You can follow my profile to get notification of the next blog post on CAP or Fiori Elements. Please feel free to provide any feedback you have in the comments section below and ask your questions about the topic in sap community using this link.
- SAP Managed Tags:
- SAP Fiori Elements,
- SAP Cloud Application Programming Model
Labels:
6 Comments
You must be a registered user to add a comment. If you've already registered, sign in. Otherwise, register and sign in.
Labels in this area
-
ABAP CDS Views - CDC (Change Data Capture)
2 -
AI
1 -
Analyze Workload Data
1 -
BTP
1 -
Business and IT Integration
2 -
Business application stu
1 -
Business Technology Platform
1 -
Business Trends
1,658 -
Business Trends
93 -
CAP
1 -
cf
1 -
Cloud Foundry
1 -
Confluent
1 -
Customer COE Basics and Fundamentals
1 -
Customer COE Latest and Greatest
3 -
Customer Data Browser app
1 -
Data Analysis Tool
1 -
data migration
1 -
data transfer
1 -
Datasphere
2 -
Event Information
1,400 -
Event Information
67 -
Expert
1 -
Expert Insights
177 -
Expert Insights
301 -
General
1 -
Google cloud
1 -
Google Next'24
1 -
GraphQL
1 -
Kafka
1 -
Life at SAP
780 -
Life at SAP
13 -
Migrate your Data App
1 -
MTA
1 -
Network Performance Analysis
1 -
NodeJS
1 -
PDF
1 -
POC
1 -
Product Updates
4,577 -
Product Updates
346 -
Replication Flow
1 -
REST API
1 -
RisewithSAP
1 -
SAP BTP
1 -
SAP BTP Cloud Foundry
1 -
SAP Cloud ALM
1 -
SAP Cloud Application Programming Model
1 -
SAP Datasphere
2 -
SAP S4HANA Cloud
1 -
SAP S4HANA Migration Cockpit
1 -
Technology Updates
6,873 -
Technology Updates
429 -
Workload Fluctuations
1
Related Content
- General Splitter in CI - Namespace Prefix Problem in Technology Blogs by Members
- SAP Fiori for SAP S/4HANA - Empowering Your Homepage: Enabling My Home for SAP S/4HANA 2023 FPS01 in Technology Blogs by SAP
- Supporting Multiple API Gateways with SAP API Management – using Azure API Management as example in Technology Blogs by SAP
- My inbox application with multiple backends(ECC,CRM) configuration Guide in Technology Q&A
- How to configure SAP system in Eclipse ? in Technology Q&A
Top kudoed authors
| User | Count |
|---|---|
| 34 | |
| 17 | |
| 15 | |
| 14 | |
| 11 | |
| 9 | |
| 8 | |
| 8 | |
| 8 | |
| 7 |