
- SAP Community
- Products and Technology
- Technology
- Technology Blogs by Members
- Sap Datasphere Data Flow Series – Operators (Joins...
Technology Blogs by Members
Explore a vibrant mix of technical expertise, industry insights, and tech buzz in member blogs covering SAP products, technology, and events. Get in the mix!
Turn on suggestions
Auto-suggest helps you quickly narrow down your search results by suggesting possible matches as you type.
Showing results for
Kunal_Mohanty
Explorer
Options
- Subscribe to RSS Feed
- Mark as New
- Mark as Read
- Bookmark
- Subscribe
- Printer Friendly Page
- Report Inappropriate Content
11-17-2023
4:49 PM
Hey Champs,
Hope you enjoyed the last blog on Sap Datasphere Data Flow Series – Introduction and sample example, well its just the trailer. Today lets jump into different types of operator in Datasphere in details.
Projection Operator:
It allows us select the required fields into the output. For example we have 100 columns in a table and we want to see only 50 columns so in that case we can use a projection operator and select our required fields.
Lets see one example where we are join two dataset named Order Table and Order Item table.
We can combine Order table and Order Item table using Order id as join condition between two dataset.
Thoda Gyan:
The size limit for files being processed by the join operator is 10 GB.
Steps :
Now click on add target table, Add in the right side details pane click on “Create and deploy target table” . And from the general tab select the mode as append and save and activate. Now in the top left corner click run as show in the below image.
.Aggregation Operator:
Aggregation refers to the function whereby key figure values on detail level are automatically summed up at runtime and shown or planned on aggregated level.
Steps:
5.Now save and deploy and run the dataflow. Then click on the target table and do data preview.
Union in Data Flow:
Union in Sap DataSphere Data Flow is used to combine two datasets. Lets take one example to combine two dataset. In my example I am taking Order Header Table and Sales Order Table. Just to show the union functionality. I will only take order number from both the dataset.
Steps:
Now we can data preview and see the complete data.
Conclusion:
This blog introduced the different types of operator available in datasphere data model that we’ll use along the entire blog series, I have explained each and every topic in detail. We can do a lot more using all these operators. I have skipped the script Operator and will cover it soon with another blog.
Thanks for reading! I hope you find this post helpful. For any questions or feedback just leave a comment below this post. Feel free to also check out the other blog posts in the series and follow me to learn as well as master sap analytics. Let me know if you find something can be improved or added.
Best wishes,
Kunal Mohanty
Hope you enjoyed the last blog on Sap Datasphere Data Flow Series – Introduction and sample example, well its just the trailer. Today lets jump into different types of operator in Datasphere in details.
Operators in SAP Data Sphere are used to manipulate and transform data. They can be used to perform a wide variety of tasks, such as filtering, sorting, aggregating, and joining data. Operators can be used in both data flows and data jobs.
Here are some of the most common operators in SAP DataSphere:
- Projection Operator
- Join Operator
- Union Operator
- Aggregation Operator
- Script Operator (We will cover in a separate blog)
Join Operator & Projection Operator in Data Flow:
In SAP Data Sphere, the Join Operator is used to combine data from two or more sources based on a common column between them
There are several types of joins available in SAP Data Sphere, each with its own purpose:
Inner Join: This is the most common type of join, and it combines data from two sources where the values in a related column match. Only rows with matching values are included in the result dataset.
Left Join: This join includes all rows from the left source, regardless of whether there is a matching row in the right source. If there is no matching row, the values for the right source's columns are displayed as null.
Right Join: This join is similar to the left join, but it includes all rows from the right source instead of the left source. If there is no matching row, the values for the left source's columns are displayed as null.
To use the Join Operator in SAP Data Sphere, you can drag and drop it onto the data flow canvas, connect it to the desired data sources, and configure the join type and join condition. The join condition specifies the related column between the sources and the values that must match for rows to be included in the result dataset.
Projection Operator:
It allows us select the required fields into the output. For example we have 100 columns in a table and we want to see only 50 columns so in that case we can use a projection operator and select our required fields.
Lets see one example where we are join two dataset named Order Table and Order Item table.
We can combine Order table and Order Item table using Order id as join condition between two dataset.
Thoda Gyan:
The size limit for files being processed by the join operator is 10 GB.
Steps :
- From the left side repository panel drag the Order header table and Order Item table to the play area as source.
- Drag and drop the join operator from operator panel to the play area.
- Now drag the projection operator in front of the Order header table, now connect the Order header table and projection.
- Now connect a line from projection and Order item table to the join operator.
- Click on projection and change the Name to Customer Name. Now click on the join operator and select inner join as shown below.
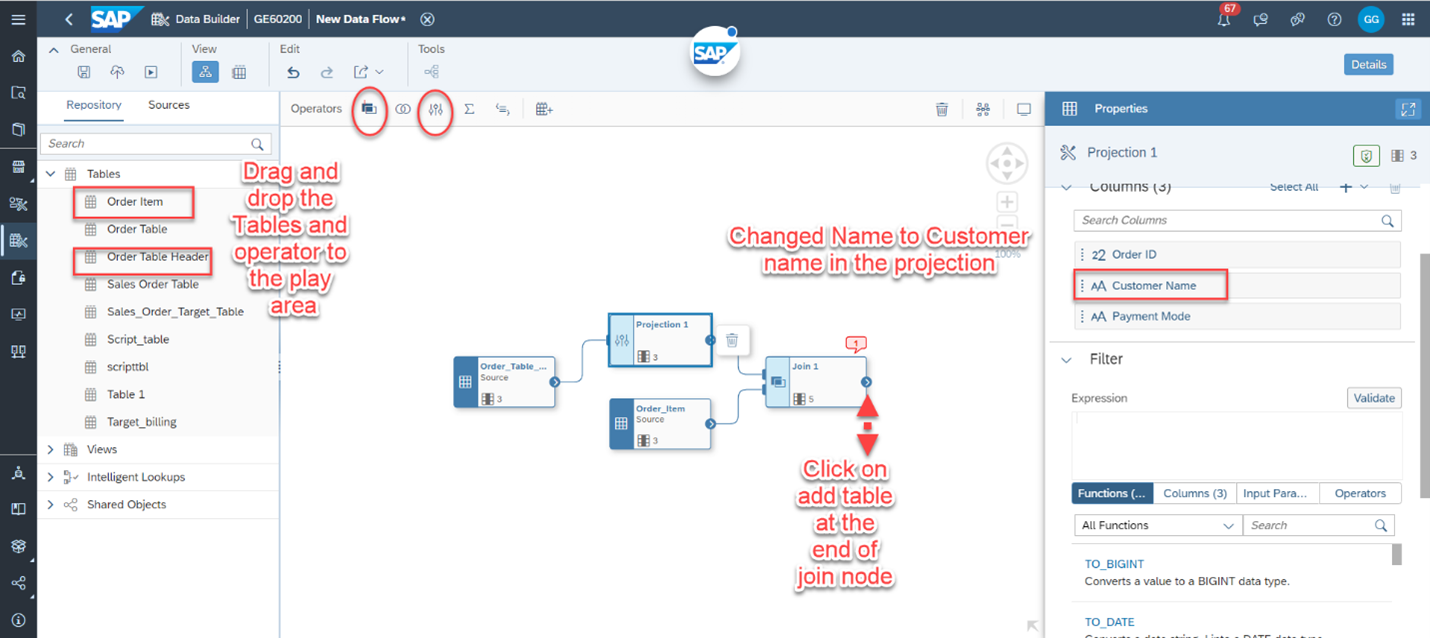
Adding a projection
Now click on add target table, Add in the right side details pane click on “Create and deploy target table” . And from the general tab select the mode as append and save and activate. Now in the top left corner click run as show in the below image.
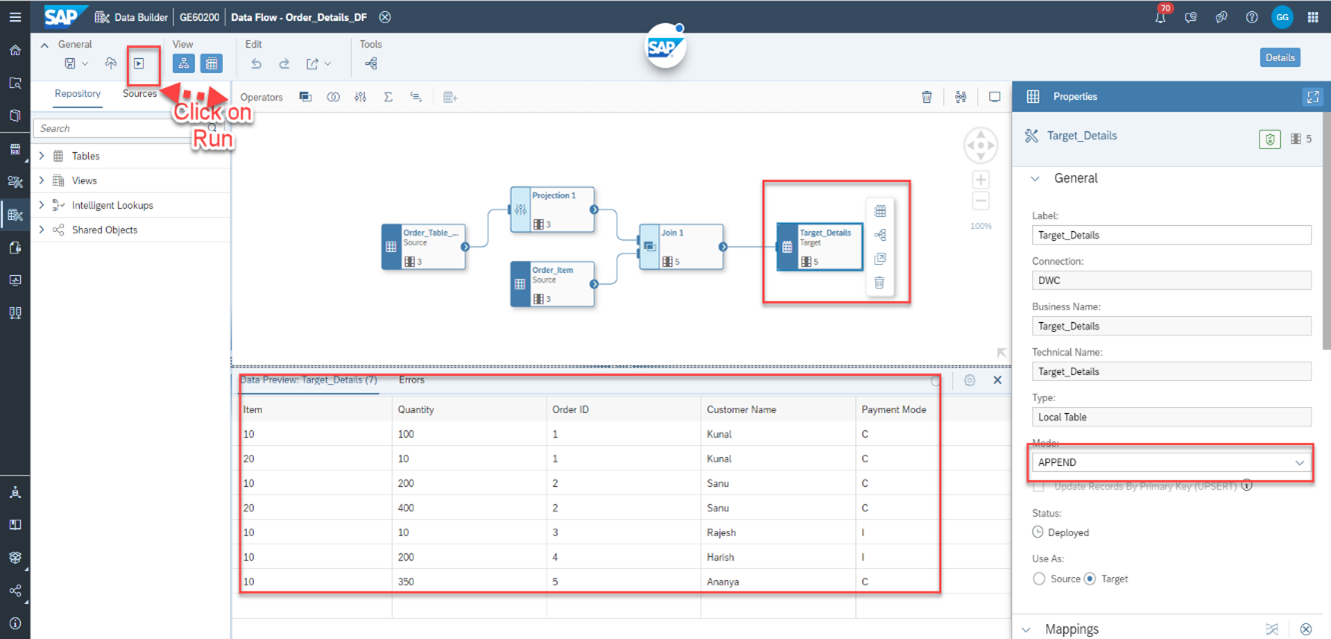
Running the Data Flow
.Aggregation Operator:
Aggregation refers to the function whereby key figure values on detail level are automatically summed up at runtime and shown or planned on aggregated level.
SUM: Calculates the total sum of values for a particular column.
AVG: Calculates the average value for a particular column.
MIN: Determines the minimum value for a particular column.
MAX: Determines the maximum value for a particular column.
COUNT: Counts the total number of non-null values for a particular column.
These aggregate functions can be applied in various scenarios within Data Sphere, including:
Analyzing sales data: By aggregating sales figures across different time periods, product categories, or customer segments, you can identify trends, patterns, and outliers in sales performance.
Calculating performance metrics: Aggregated functions can be used to assess employee performance, track website traffic, or evaluate the impact of marketing campaigns.
Identifying trends in sensor data: By aggregating sensor readings over time, you can detect patterns and anomalies in environmental conditions, equipment performance, or user behavior.
Generating summary reports for companies: Aggregated data can be used to create informative reports that highlight key findings and trends.
Steps:
- Using the previous flow after Order item table, drag a projection to the play area and remove the item column from the projection. Keep those that you want to aggregate and those that you want to group the aggregations by.
- Click the Aggregation tool, drag it onto the diagram canvas, and release it where you want to create the aggregation.
- Click on aggregation and click the column named Item and then select the aggregation type as Sum.
- Join the flow between projection, aggregation and join.
![]()
Adding the Aggregation Node
5.Now save and deploy and run the dataflow. Then click on the target table and do data preview.

Data Preview of Aggregation Node
Union in Data Flow:
Union in Sap DataSphere Data Flow is used to combine two datasets. Lets take one example to combine two dataset. In my example I am taking Order Header Table and Sales Order Table. Just to show the union functionality. I will only take order number from both the dataset.
Steps:
- Drag and drop Order Table Header into the play area as source and add a projection and connect the source table and projection. Now enable the Order Id column.
- Drag and drop Sales Order Table into the play area as source and add a projection and connect the source table and projection. Now enable the Order Id column.
- Drag and drop the union node into the play area.
- Now connect the flow of the projection to the union node
- Click on the union node and map the order id of both the table. And go to the unmapped section and delete the columns which are not mapped.
- Now save and deploy it and click on run to see the data preview..
Before lets look into the ingredients for the dish :

Order Header Table

Order Item Table
Now we can data preview and see the complete data.

Adding the Union Operator
Conclusion:
This blog introduced the different types of operator available in datasphere data model that we’ll use along the entire blog series, I have explained each and every topic in detail. We can do a lot more using all these operators. I have skipped the script Operator and will cover it soon with another blog.
Thanks for reading! I hope you find this post helpful. For any questions or feedback just leave a comment below this post. Feel free to also check out the other blog posts in the series and follow me to learn as well as master sap analytics. Let me know if you find something can be improved or added.
Best wishes,
Kunal Mohanty
- SAP Managed Tags:
- SAP Datasphere,
- Data and Analytics,
- SAP Analytics Hub
You must be a registered user to add a comment. If you've already registered, sign in. Otherwise, register and sign in.
Labels in this area
-
"automatische backups"
1 -
"regelmäßige sicherung"
1 -
"TypeScript" "Development" "FeedBack"
1 -
505 Technology Updates 53
1 -
ABAP
14 -
ABAP API
1 -
ABAP CDS Views
2 -
ABAP CDS Views - BW Extraction
1 -
ABAP CDS Views - CDC (Change Data Capture)
1 -
ABAP class
2 -
ABAP Cloud
3 -
ABAP Development
5 -
ABAP in Eclipse
1 -
ABAP Platform Trial
1 -
ABAP Programming
2 -
abap technical
1 -
abapGit
1 -
absl
2 -
access data from SAP Datasphere directly from Snowflake
1 -
Access data from SAP datasphere to Qliksense
1 -
Accrual
1 -
action
1 -
adapter modules
1 -
Addon
1 -
Adobe Document Services
1 -
ADS
1 -
ADS Config
1 -
ADS with ABAP
1 -
ADS with Java
1 -
ADT
2 -
Advance Shipping and Receiving
1 -
Advanced Event Mesh
3 -
AEM
1 -
AI
7 -
AI Launchpad
1 -
AI Projects
1 -
AIML
9 -
Alert in Sap analytical cloud
1 -
Amazon S3
1 -
Analytical Dataset
1 -
Analytical Model
1 -
Analytics
1 -
Analyze Workload Data
1 -
annotations
1 -
API
1 -
API and Integration
3 -
API Call
2 -
API security
1 -
Application Architecture
1 -
Application Development
5 -
Application Development for SAP HANA Cloud
3 -
Applications and Business Processes (AP)
1 -
Artificial Intelligence
1 -
Artificial Intelligence (AI)
5 -
Artificial Intelligence (AI) 1 Business Trends 363 Business Trends 8 Digital Transformation with Cloud ERP (DT) 1 Event Information 462 Event Information 15 Expert Insights 114 Expert Insights 76 Life at SAP 418 Life at SAP 1 Product Updates 4
1 -
Artificial Intelligence (AI) blockchain Data & Analytics
1 -
Artificial Intelligence (AI) blockchain Data & Analytics Intelligent Enterprise
1 -
Artificial Intelligence (AI) blockchain Data & Analytics Intelligent Enterprise Oil Gas IoT Exploration Production
1 -
Artificial Intelligence (AI) blockchain Data & Analytics Intelligent Enterprise sustainability responsibility esg social compliance cybersecurity risk
1 -
ASE
1 -
ASR
2 -
ASUG
1 -
Attachments
1 -
Authorisations
1 -
Automating Processes
1 -
Automation
2 -
aws
2 -
Azure
1 -
Azure AI Studio
1 -
Azure API Center
1 -
Azure API Management
1 -
B2B Integration
1 -
Backorder Processing
1 -
Backup
1 -
Backup and Recovery
1 -
Backup schedule
1 -
BADI_MATERIAL_CHECK error message
1 -
Bank
1 -
BAS
1 -
basis
2 -
Basis Monitoring & Tcodes with Key notes
2 -
Batch Management
1 -
BDC
1 -
Best Practice
1 -
bitcoin
1 -
Blockchain
3 -
bodl
1 -
BOP in aATP
1 -
BOP Segments
1 -
BOP Strategies
1 -
BOP Variant
1 -
BPC
1 -
BPC LIVE
1 -
BTP
13 -
BTP Destination
2 -
Business AI
1 -
Business and IT Integration
1 -
Business application stu
1 -
Business Application Studio
1 -
Business Architecture
1 -
Business Communication Services
1 -
Business Continuity
1 -
Business Data Fabric
3 -
Business Fabric
1 -
Business Partner
12 -
Business Partner Master Data
10 -
Business Technology Platform
2 -
Business Trends
4 -
BW4HANA
1 -
CA
1 -
calculation view
1 -
CAP
4 -
Capgemini
1 -
CAPM
1 -
Catalyst for Efficiency: Revolutionizing SAP Integration Suite with Artificial Intelligence (AI) and
1 -
CCMS
2 -
CDQ
12 -
CDS
2 -
Cental Finance
1 -
Certificates
1 -
CFL
1 -
Change Management
1 -
chatbot
1 -
chatgpt
3 -
CL_SALV_TABLE
2 -
Class Runner
1 -
Classrunner
1 -
Cloud ALM Monitoring
1 -
Cloud ALM Operations
1 -
cloud connector
1 -
Cloud Extensibility
1 -
Cloud Foundry
4 -
Cloud Integration
6 -
Cloud Platform Integration
2 -
cloudalm
1 -
communication
1 -
Compensation Information Management
1 -
Compensation Management
1 -
Compliance
1 -
Compound Employee API
1 -
Configuration
1 -
Connectors
1 -
Consolidation Extension for SAP Analytics Cloud
2 -
Control Indicators.
1 -
Controller-Service-Repository pattern
1 -
Conversion
1 -
Cosine similarity
1 -
cryptocurrency
1 -
CSI
1 -
ctms
1 -
Custom chatbot
3 -
Custom Destination Service
1 -
custom fields
1 -
Customer Experience
1 -
Customer Journey
1 -
Customizing
1 -
cyber security
3 -
cybersecurity
1 -
Data
1 -
Data & Analytics
1 -
Data Aging
1 -
Data Analytics
2 -
Data and Analytics (DA)
1 -
Data Archiving
1 -
Data Back-up
1 -
Data Flow
1 -
Data Governance
5 -
Data Integration
2 -
Data Quality
12 -
Data Quality Management
12 -
Data Synchronization
1 -
data transfer
1 -
Data Unleashed
1 -
Data Value
8 -
database tables
1 -
Datasphere
3 -
datenbanksicherung
1 -
dba cockpit
1 -
dbacockpit
1 -
Debugging
2 -
Defender
1 -
Delimiting Pay Components
1 -
Delta Integrations
1 -
Destination
3 -
Destination Service
1 -
Developer extensibility
1 -
Developing with SAP Integration Suite
1 -
Devops
1 -
digital transformation
1 -
Documentation
1 -
Dot Product
1 -
DQM
1 -
dump database
1 -
dump transaction
1 -
e-Invoice
1 -
E4H Conversion
1 -
Eclipse ADT ABAP Development Tools
2 -
edoc
1 -
edocument
1 -
ELA
1 -
Embedded Consolidation
1 -
Embedding
1 -
Embeddings
1 -
Employee Central
1 -
Employee Central Payroll
1 -
Employee Central Time Off
1 -
Employee Information
1 -
Employee Rehires
1 -
Enable Now
1 -
Enable now manager
1 -
endpoint
1 -
Enhancement Request
1 -
Enterprise Architecture
1 -
ESLint
1 -
ETL Business Analytics with SAP Signavio
1 -
Euclidean distance
1 -
Event Dates
1 -
Event Driven Architecture
1 -
Event Mesh
2 -
Event Reason
1 -
EventBasedIntegration
1 -
EWM
1 -
EWM Outbound configuration
1 -
EWM-TM-Integration
1 -
Existing Event Changes
1 -
Expand
1 -
Expert
2 -
Expert Insights
2 -
Exploits
1 -
Fiori
14 -
Fiori Elements
2 -
Fiori SAPUI5
12 -
first-guidance
1 -
Flask
1 -
FTC
1 -
Full Stack
8 -
Funds Management
1 -
gCTS
1 -
General
1 -
Generative AI
1 -
Getting Started
1 -
GitHub
9 -
Grants Management
1 -
groovy
1 -
GTP
1 -
HANA
6 -
HANA Cloud
2 -
Hana Cloud Database Integration
2 -
HANA DB
2 -
HANA XS Advanced
1 -
Historical Events
1 -
home labs
1 -
HowTo
1 -
HR Data Management
1 -
html5
8 -
HTML5 Application
1 -
Identity cards validation
1 -
idm
1 -
Implementation
1 -
input parameter
1 -
instant payments
1 -
Integration
3 -
Integration Advisor
1 -
Integration Architecture
1 -
Integration Center
1 -
Integration Suite
1 -
intelligent enterprise
1 -
iot
1 -
Java
1 -
job
1 -
Job Information Changes
1 -
Job-Related Events
1 -
Job_Event_Information
1 -
joule
4 -
Journal Entries
1 -
Just Ask
1 -
Kerberos for ABAP
8 -
Kerberos for JAVA
8 -
KNN
1 -
Launch Wizard
1 -
Learning Content
2 -
Life at SAP
5 -
lightning
1 -
Linear Regression SAP HANA Cloud
1 -
Loading Indicator
1 -
local tax regulations
1 -
LP
1 -
Machine Learning
2 -
Marketing
1 -
Master Data
3 -
Master Data Management
14 -
Maxdb
2 -
MDG
1 -
MDGM
1 -
MDM
1 -
Message box.
1 -
Messages on RF Device
1 -
Microservices Architecture
1 -
Microsoft Universal Print
1 -
Middleware Solutions
1 -
Migration
5 -
ML Model Development
1 -
Modeling in SAP HANA Cloud
8 -
Monitoring
3 -
MTA
1 -
Multi-Record Scenarios
1 -
Multiple Event Triggers
1 -
Myself Transformation
1 -
Neo
1 -
New Event Creation
1 -
New Feature
1 -
Newcomer
1 -
NodeJS
3 -
ODATA
2 -
OData APIs
1 -
odatav2
1 -
ODATAV4
1 -
ODBC
1 -
ODBC Connection
1 -
Onpremise
1 -
open source
2 -
OpenAI API
1 -
Oracle
1 -
PaPM
1 -
PaPM Dynamic Data Copy through Writer function
1 -
PaPM Remote Call
1 -
PAS-C01
1 -
Pay Component Management
1 -
PGP
1 -
Pickle
1 -
PLANNING ARCHITECTURE
1 -
Popup in Sap analytical cloud
1 -
PostgrSQL
1 -
POSTMAN
1 -
Prettier
1 -
Process Automation
2 -
Product Updates
5 -
PSM
1 -
Public Cloud
1 -
Python
4 -
python library - Document information extraction service
1 -
Qlik
1 -
Qualtrics
1 -
RAP
3 -
RAP BO
2 -
Record Deletion
1 -
Recovery
1 -
recurring payments
1 -
redeply
1 -
Release
1 -
Remote Consumption Model
1 -
Replication Flows
1 -
research
1 -
Resilience
1 -
REST
1 -
REST API
1 -
Retagging Required
1 -
Risk
1 -
Rolling Kernel Switch
1 -
route
1 -
rules
1 -
S4 HANA
1 -
S4 HANA Cloud
1 -
S4 HANA On-Premise
1 -
S4HANA
3 -
S4HANA_OP_2023
2 -
SAC
10 -
SAC PLANNING
9 -
SAP
4 -
SAP ABAP
1 -
SAP Advanced Event Mesh
1 -
SAP AI Core
8 -
SAP AI Launchpad
8 -
SAP Analytic Cloud Compass
1 -
Sap Analytical Cloud
1 -
SAP Analytics Cloud
4 -
SAP Analytics Cloud for Consolidation
3 -
SAP Analytics Cloud Story
1 -
SAP analytics clouds
1 -
SAP API Management
1 -
SAP BAS
1 -
SAP Basis
6 -
SAP BODS
1 -
SAP BODS certification.
1 -
SAP BTP
21 -
SAP BTP Build Work Zone
2 -
SAP BTP Cloud Foundry
6 -
SAP BTP Costing
1 -
SAP BTP CTMS
1 -
SAP BTP Innovation
1 -
SAP BTP Migration Tool
1 -
SAP BTP SDK IOS
1 -
SAP BTPEA
1 -
SAP Build
11 -
SAP Build App
1 -
SAP Build apps
1 -
SAP Build CodeJam
1 -
SAP Build Process Automation
3 -
SAP Build work zone
10 -
SAP Business Objects Platform
1 -
SAP Business Technology
2 -
SAP Business Technology Platform (XP)
1 -
sap bw
1 -
SAP CAP
2 -
SAP CDC
1 -
SAP CDP
1 -
SAP CDS VIEW
1 -
SAP Certification
1 -
SAP Cloud ALM
4 -
SAP Cloud Application Programming Model
1 -
SAP Cloud Integration for Data Services
1 -
SAP cloud platform
8 -
SAP Companion
1 -
SAP CPI
3 -
SAP CPI (Cloud Platform Integration)
2 -
SAP CPI Discover tab
1 -
sap credential store
1 -
SAP Customer Data Cloud
1 -
SAP Customer Data Platform
1 -
SAP Data Intelligence
1 -
SAP Data Migration in Retail Industry
1 -
SAP Data Services
1 -
SAP DATABASE
1 -
SAP Dataspher to Non SAP BI tools
1 -
SAP Datasphere
9 -
SAP DRC
1 -
SAP EWM
1 -
SAP Fiori
3 -
SAP Fiori App Embedding
1 -
Sap Fiori Extension Project Using BAS
1 -
SAP GRC
1 -
SAP HANA
1 -
SAP HCM (Human Capital Management)
1 -
SAP HR Solutions
1 -
SAP IDM
1 -
SAP Integration Suite
9 -
SAP Integrations
4 -
SAP iRPA
2 -
SAP LAGGING AND SLOW
1 -
SAP Learning Class
1 -
SAP Learning Hub
1 -
SAP Master Data
1 -
SAP Odata
2 -
SAP on Azure
2 -
SAP PartnerEdge
1 -
sap partners
1 -
SAP Password Reset
1 -
SAP PO Migration
1 -
SAP Prepackaged Content
1 -
SAP Process Automation
2 -
SAP Process Integration
2 -
SAP Process Orchestration
1 -
SAP S4HANA
2 -
SAP S4HANA Cloud
1 -
SAP S4HANA Cloud for Finance
1 -
SAP S4HANA Cloud private edition
1 -
SAP Sandbox
1 -
SAP STMS
1 -
SAP successfactors
3 -
SAP SuccessFactors HXM Core
1 -
SAP Time
1 -
SAP TM
2 -
SAP Trading Partner Management
1 -
SAP UI5
1 -
SAP Upgrade
1 -
SAP Utilities
1 -
SAP-GUI
8 -
SAP_COM_0276
1 -
SAPBTP
1 -
SAPCPI
1 -
SAPEWM
1 -
sapfirstguidance
1 -
SAPHANAService
1 -
SAPIQ
1 -
sapmentors
1 -
saponaws
2 -
SAPS4HANA
1 -
SAPUI5
5 -
schedule
1 -
Script Operator
1 -
Secure Login Client Setup
8 -
security
9 -
Selenium Testing
1 -
Self Transformation
1 -
Self-Transformation
1 -
SEN
1 -
SEN Manager
1 -
service
1 -
SET_CELL_TYPE
1 -
SET_CELL_TYPE_COLUMN
1 -
SFTP scenario
2 -
Simplex
1 -
Single Sign On
8 -
Singlesource
1 -
SKLearn
1 -
Slow loading
1 -
soap
1 -
Software Development
1 -
SOLMAN
1 -
solman 7.2
2 -
Solution Manager
3 -
sp_dumpdb
1 -
sp_dumptrans
1 -
SQL
1 -
sql script
1 -
SSL
8 -
SSO
8 -
Substring function
1 -
SuccessFactors
1 -
SuccessFactors Platform
1 -
SuccessFactors Time Tracking
1 -
Sybase
1 -
system copy method
1 -
System owner
1 -
Table splitting
1 -
Tax Integration
1 -
Technical article
1 -
Technical articles
1 -
Technology Updates
15 -
Technology Updates
1 -
Technology_Updates
1 -
terraform
1 -
Threats
2 -
Time Collectors
1 -
Time Off
2 -
Time Sheet
1 -
Time Sheet SAP SuccessFactors Time Tracking
1 -
Tips and tricks
2 -
toggle button
1 -
Tools
1 -
Trainings & Certifications
1 -
Transformation Flow
1 -
Transport in SAP BODS
1 -
Transport Management
1 -
TypeScript
3 -
ui designer
1 -
unbind
1 -
Unified Customer Profile
1 -
UPB
1 -
Use of Parameters for Data Copy in PaPM
1 -
User Unlock
1 -
VA02
1 -
Validations
1 -
Vector Database
2 -
Vector Engine
1 -
Visual Studio Code
1 -
VSCode
2 -
VSCode extenions
1 -
Vulnerabilities
1 -
Web SDK
1 -
work zone
1 -
workload
1 -
xsa
1 -
XSA Refresh
1
- « Previous
- Next »
Related Content
- Data Flows - The Python Script Operator and why you should avoid it in Technology Blogs by Members
- CDS View: Hierarchy node sign reversal in Technology Blogs by SAP
- SAP Datasphere - Space, Data Integration, and Data Modeling Best Practices in Technology Blogs by SAP
- What’s New in SAP Analytics Cloud Release 2024.06 in Technology Blogs by SAP
- Convert Analytical Dataset to Analytical Model without impacting consumers (external tools like SAC) in Technology Blogs by Members
Top kudoed authors
| User | Count |
|---|---|
| 9 | |
| 8 | |
| 5 | |
| 5 | |
| 4 | |
| 4 | |
| 4 | |
| 3 | |
| 3 | |
| 3 |