
- SAP Community
- Products and Technology
- Product Lifecycle Management
- PLM Blogs by SAP
- SAP Digital Manufacturing for Insights: Line Monit...
Product Lifecycle Management Blogs by SAP
Dive into product lifecycle management news, learn about digitalizing PLM for the digital supply chain, and stay informed with product updates from SAP.
Turn on suggestions
Auto-suggest helps you quickly narrow down your search results by suggesting possible matches as you type.
Showing results for
Advisor
Options
- Subscribe to RSS Feed
- Mark as New
- Mark as Read
- Bookmark
- Subscribe
- Printer Friendly Page
- Report Inappropriate Content
12-01-2023
2:25 PM
Introduction
SAP Digital Manufacturing for Insights Default Line Monitor provides some great features which I want to describe in more detail.
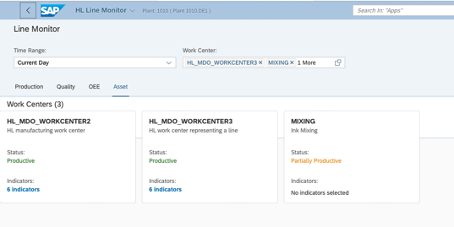
Asset Overview
In the Asset Overview plugin, you will find for each work center a colored status information. It reflects whether for a work center all resources are productive (green, all resources active), partially productive (yellow, some resources active and others down), or down (red, all resources down). In addition, if the feature to expose last indicator values is configured, you will find information on the number of indicators per work center that are configured to be exposed. More information on Last Indicator Value plugin can be found further below.
Availability Summary and Availability Details
You can now leverage the availability plugins to visualize availability data of work center resources for the current day or since previous day. The Availability Summary plugin exposes availability strips for up to five parent resources (work center resources not assigned as children of other resources in the OEE hierarchy).

Each availability strip exposes the duration a resource has spent in status productive, scheduled down, or unscheduled down. As the data exposure is not related to any shift information, shift breaks are not exposed.
Next to the resource name on the left, the information of OEE relevance is exposed. On the right-hand side of the chart the current availability status of the resource is displayed in the respective color. The hierarchy icon along with the number indicates whether the resource has child resources assigned and how many.
If there are more than 5 parent resources assigned to the work center, clicking on the Availability Chart header will navigate into a full screen exposure of all parent resources assigned to the work center.
To see the complete picture of all parent resources and their child resources, you can navigate to the Availability Details plugin by clicking on any of the parent resources or their chart being displayed. The Availability Details plugin exposes the list of all parent resources and next to it the list of the child resources for a selected parent resource, which is marked as selected. All resource availabilities are shown along with the actual status of each resource. For each child resource, next to the resource name, it is indicated whether the resource is marked as bottleneck.

Via the full screen icon on the right upper corner of the child resource chart you can get to a full screen exposure of all child resources for a selected parent resource, and you can use the same icon to return to the parent-child display. The cancel button next to it will navigate back to the parent resource view.
Last Indicator Value
With the Last Indicator Value plugin, you can expose the last values of selected indicators, regardless of whether indicators are tagged for connectivity or whether they are used as local indicators. The plugin is not included in the Default Line Monitor, as it requires specific configuration.
At design time of the Last Indicator Value plugin, leveraging the configure indicators button in the plugin configuration, you can define per work center the indicators that shall potentially be exposed. Indicators are listed for assets/equipment assigned to work center resources.


On the left of the configuration screen all work centers are listed, with the ones on the top for which indicators have already been selected for Line Monitor exposure. Those are marked with a blue line on the left. Below each work center the identifying names of asset/equipment are listed that are assigned to the work center resources.
On the right side of the configuration screen the indicators of the selected asset/equipment are listed for selection. Name, description, and structure path allow the unique identification of indicators.
The configuration data is cached in the application, to support better performance after the first call. If you miss any data exposed for work center, asset/equipment, or indicator, you can leverage the refresh icon on the right upper corner of the configuration screen, to invalidate and update the cache accordingly.
At runtime, for the selected work center, each indicator is exposed individually along with the latest value populated.
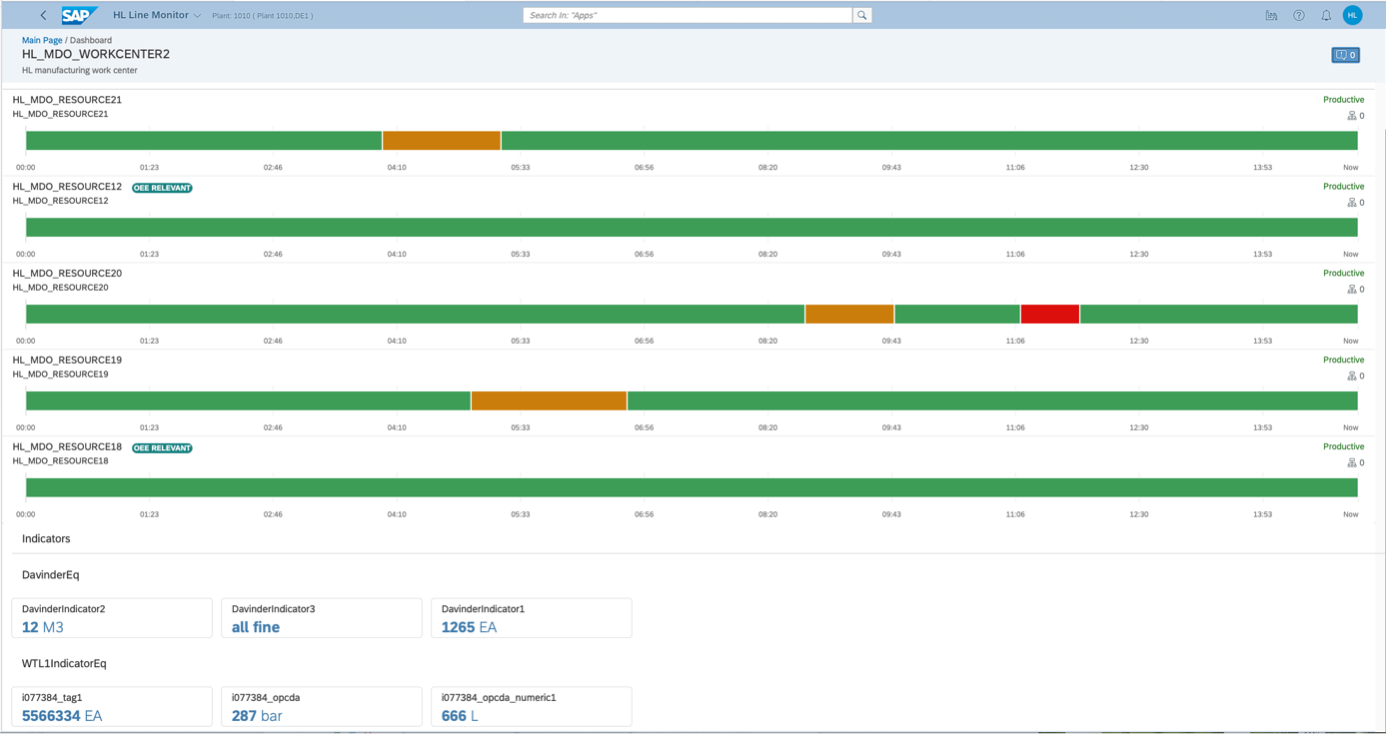
Indicators are structure by asset/equipment and hence by resource.
Once a new indicator value is pushed via the Last Indicator Value service to the Line Monitor application, the application itself will push the values to all instances of Line Monitor PODs that have the indicator selected for exposure. The update of the last value is independent of the auto-refresh configured for Line Monitor.
Please note that last indicator values are directly pushed to the Line Monitor plugin and are currently not being cached. Hence, accessing the Line Monitor perspective including the Last Indicator Value plugin the first time, will not expose any values until a new and recent value is posted. The same will happen once the perspective is changed and revisited again. We are planning to change that behavior in one of the next releases. For the time being, you can help yourselves by pushing the indicator values to the application at the frequency needed.
As a pre-requisite for indicator values to be populated to Line Monitor, you need to invoke the new service Post Last Indicator Values , that is exposed in the service registry.

You can call the service as part of a production process or via the Manage Automatic Triggers application. In the Production Process Designer, the service can be found as cloud service under Last Indicator Value.

The assetID is the unique ID of an asset/equipment and can be taken from the respective Manage Assets/Equipment application. The structure path is needed if an indicator is used multiple times within an asset/equipment. For an asset, the path of reference names separated by “/”, from the root structure to the indicator, needs to be maintained, for equipment the template/indicator group must be maintained.
For more details, please check https://blogs.sap.com/2023/11/23/last-indicator-value-in-line-monitor-within-sap-digital-manufacturi...
Auto-Refresh of plugins
You may want to use Line Monitor to expose data and key figures that shall be accurate and reflecting the latest information. To overcome the need to manually refresh the Monitor to retrieve the latest data, at design time configuration of Line Monitor Selection plugin you can now enable and define in seconds the time by when plugins exposed shall automatically be refreshed. The smallest value accepted is 10 seconds, calculated from the time the last plugin that is displayed has been refreshed. As refresh of plugin data is associated with a flickering of the Line Monitor UI, the auto refresh interval should be set with caution.

The Last Indicator Value plugin is excluded from the auto-refresh. Any new data being posted to the Line Monitor application will be pushed to the Last Indicator Value plugin without any delay.
Custom Scrap Categories
Customers often require a differentiated view on quantities reported as scrap. You can define in Line Monitor design time for the Line Monitor Yield And Scrap plugin up to three custom scrap categories. You can define a label to be exposed on the UI along with the set of reason codes for which scrap records shall be summarized per scrap category. You can additionally mark whether the custom scrap category shall be enabled for visualization.
Please note that Line Monitor Yield And Scrap plugin is currently only supported for process industry/process orders. For discrete industry production orders information in some scenarios may be inconsistently displayed. The plugin is planned to be supporting discrete industry production orders with the 2402 release of Digital Manufacturing.

At runtime, scrap quantities will then be exposed according to the summary of records per reason codes assigned.

Do you like this post? Please let me know in the comments section what you think. Any feedback is highly appreciated.
Or, if you have any questions, please check SAP Community Q&A Area, or share in https://community.sap.com/topics/digital-manufacturing , or comment down below.
Thanks,
Harry Lube
- SAP Managed Tags:
- SAP Digital Manufacturing,
- SAP Digital Manufacturing Insights
Labels:
You must be a registered user to add a comment. If you've already registered, sign in. Otherwise, register and sign in.
Labels in this area
Related Content
- How to use Digital Manufacturing MDOs within PPD Example: Where-Used Report with Follow-up Actions in Product Lifecycle Management Blogs by SAP
- Error on setup of Discrete Production Orders in Order POD within SAP Digital Manufacturing in Product Lifecycle Management Q&A
- Manage Task Fiori Features - App F3091 in Product Lifecycle Management Q&A
- Meet PLM experts from SAP at Hannover Messe 2024 in Product Lifecycle Management Blogs by SAP
- Meet PLM experts from SAP at Hannover Messe 2024 in Product Lifecycle Management Blogs by SAP
Top kudoed authors
| User | Count |
|---|---|
| 2 | |
| 2 | |
| 2 | |
| 2 | |
| 1 | |
| 1 | |
| 1 |