

- SAP Community
- Products and Technology
- Product Lifecycle Management
- PLM Blogs by SAP
- Line Monitor: Steps (Texts and Screenshots based) ...
Product Lifecycle Management Blogs by SAP
Dive into product lifecycle management news, learn about digitalizing PLM for the digital supply chain, and stay informed with product updates from SAP.
Turn on suggestions
Auto-suggest helps you quickly narrow down your search results by suggesting possible matches as you type.
Showing results for
former_member24
Active Participant
Options
- Subscribe to RSS Feed
- Mark as New
- Mark as Read
- Bookmark
- Subscribe
- Printer Friendly Page
- Report Inappropriate Content
12-02-2021
1:34 PM
In this blog post, I would like to introduce you to the latest offering of Line Monitor from SAP Digital Manufacturing Cloud. LM is not an official SAP abbreviation and I will refer Line Monitor as LM for the sake of brevity and easiness to read.
LM can be configured as POD, published in SAP Digital Manufacturing Cloud dashboard, and run as one of the SAP Digital Manufacturing Cloud apps. This app serves as monitor to be used by production supervisor and this was the reason a custom POD type "Monitor" was created in POD Designer. This assumes a lot of significance as this is the first time in SAP Digital Manufacturing Cloud, multiple perspectives of production process can be monitored using single app i.e. LM.
This blog post is meant to give overview of LM and take you through one full cycle to understand, design, publish, and run LM in SAP Digital Manufacturing Cloud dashboard. There may be certain authorizations, prerequisites needed for you to login to SAP Digital Manufacturing Cloud tenant, to access some of the needed services and this blog post assumes that one has all the necessary authorization and infrastructure setup. As and when such a requirement needs to be fulfilled, it will be highlighted in that section.
Flow of this blog post would be as follows:
LM POD has to be designed and configured before it can be published and run. Following is the step-by-step guide on how to design and configure LM. I have tried to cover all steps but in case there is some confusion, missed opportunities etc., do let me know or contact your skilled IT consultant. This design is suggested way and customer can choose to design LM in different way as LM is built using set of plugins. Typically, at the end of this blog post, one shall get running LM POD looking like similar to this (illustration purpose only, as multiple perspectives or combined into one screen shot- ignore circled numbers as they are used to denote various perspectives and shall not be part of runtime of LM😞
As suggested above, typically, designing and publishing of Line Monitor POD is done by IT consultant who knows how to use POD Designer in SAP Digital Manufacturing Cloud. With SAP Digital Manufacturing Cloud release 2111 users will be able to find various plugins of LM and design, save, publish LM.
Please follow the steps below to publish LM POD. In each step, do save your work frequently to avoid losing it. Of course, first step would be to login into SAP Digital Manufacturing Cloud tenants (with all the necessary setup already done) with user ID which has all the necessary authorizations.
In the Work Centers Page, add Icon Tab Bar control and create 4 page containers to hold 4 overview perspectives as shown:
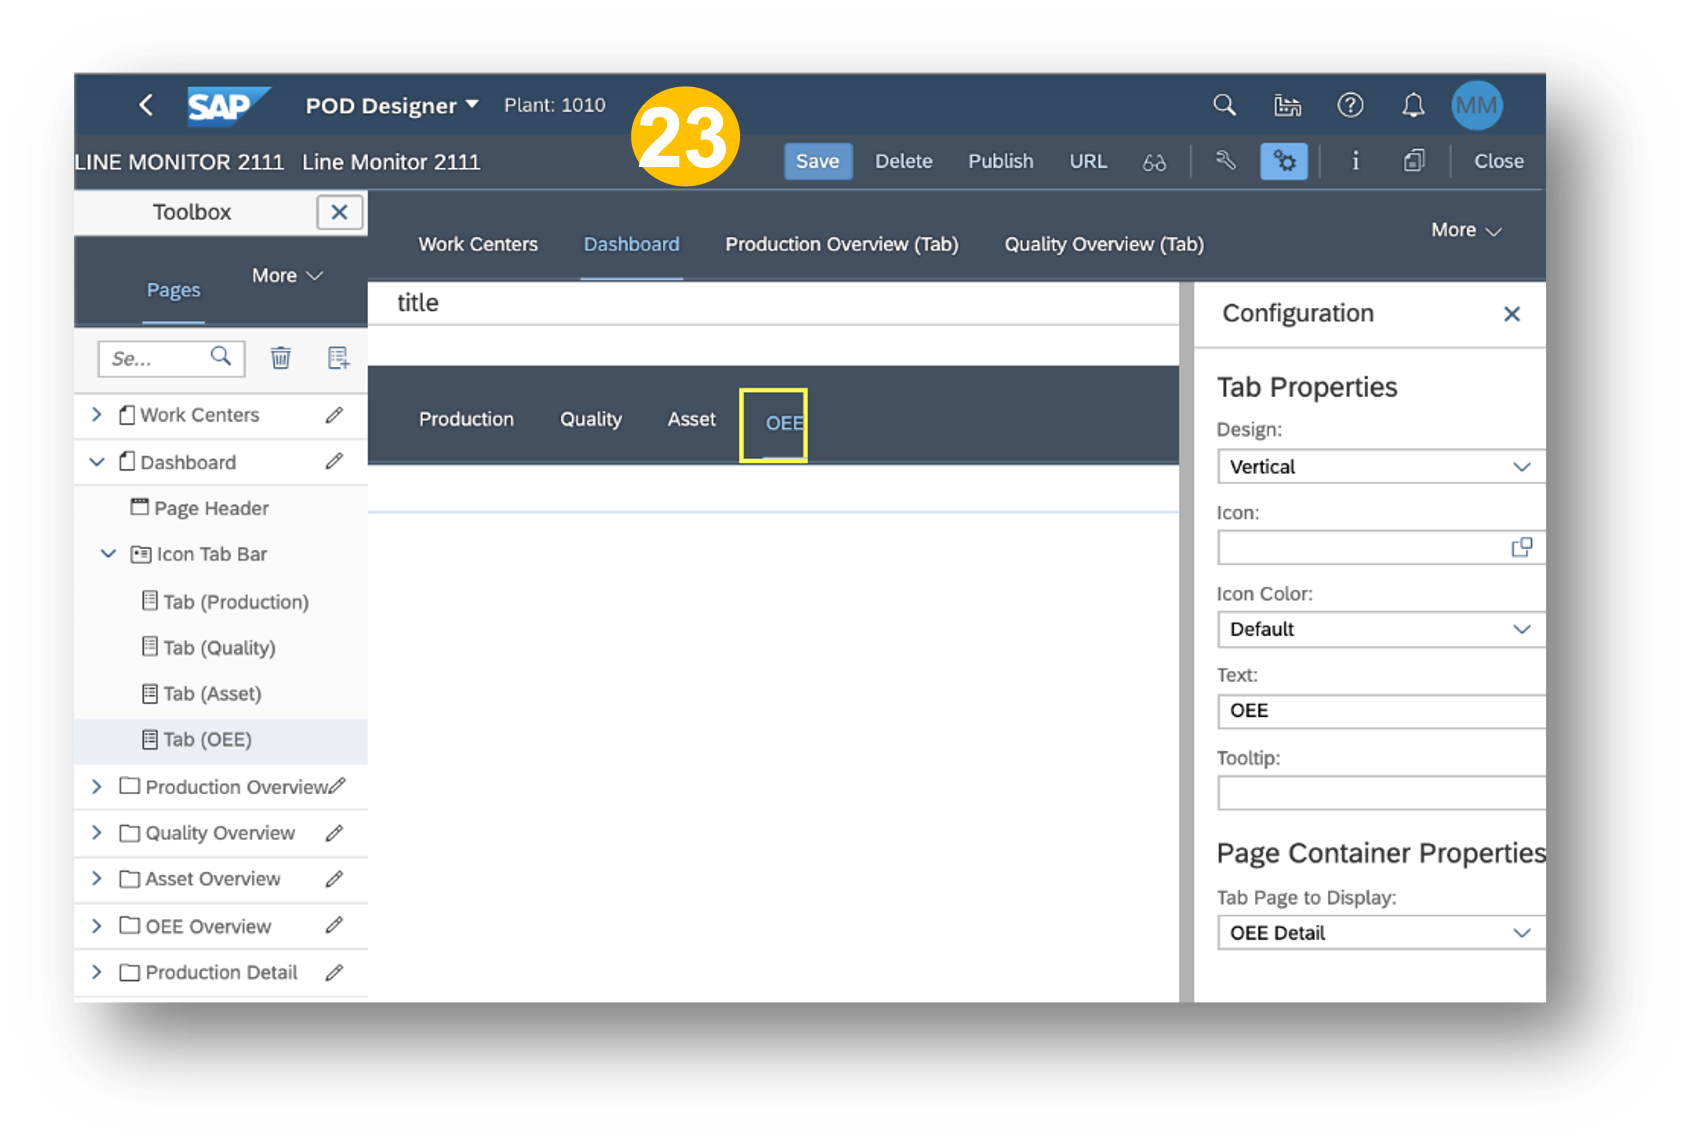
In the Dashboard, add Icon Tab Bar control and create 4 page container to hold 4 detail perspectives as shown:
As is clear, even the best of best products need enhancements, enrichments, upgrades to keep up with technology and ever changing customer requirements. In that context, I would welcome all the feedbacks, thoughts, comments, suggestions on product improvements/ new features from our esteemed readers, customer, partners, colleagues on this blog post of Line Monitor (LM). You may also use component MFG-DM-MI-LM to send your feedback (or for incident reporting) on the usage of LM.
I also would request and encourage you to follow tags and my profile to be first to know about latest and greatest on LM.
You can also look at QnA in following communities and ask questions as well (and don't forget to include tags of LM and Line Monitor in your question(s)):
SAP Digital Manufacturing Cloud
SAP Digital Manufacturing Cloud Insights
Again, thanks for reading this blog post and posting all the feedbacks, thoughts, comments, suggestions on product improvements/ new features.
LM can be configured as POD, published in SAP Digital Manufacturing Cloud dashboard, and run as one of the SAP Digital Manufacturing Cloud apps. This app serves as monitor to be used by production supervisor and this was the reason a custom POD type "Monitor" was created in POD Designer. This assumes a lot of significance as this is the first time in SAP Digital Manufacturing Cloud, multiple perspectives of production process can be monitored using single app i.e. LM.
This blog post is meant to give overview of LM and take you through one full cycle to understand, design, publish, and run LM in SAP Digital Manufacturing Cloud dashboard. There may be certain authorizations, prerequisites needed for you to login to SAP Digital Manufacturing Cloud tenant, to access some of the needed services and this blog post assumes that one has all the necessary authorization and infrastructure setup. As and when such a requirement needs to be fulfilled, it will be highlighted in that section.
Flow of this blog post would be as follows:
- Overall Context and Business Needs
- Pre-requisite and out of scope
- Overall context and business needs
- Personas
- Design, Configure, and Publish
- Run
- Summary
Overall Context and Business Needs
- LM should enable Shop Floor Production Supervisors to monitor, track, and measure production to meet business goals.
- LM should provide insights from various production perspectives: Production Target, Production Quality, Assets, and Overall Equipment Effectiveness (OEE).
Pre-requisites and out of scope
- As LM is part of SAP Digital Manufacturing Cloud, usage of this application requires necessary authorization to configure and run SAP Digital Manufacturing Cloud PODs in specific SAP Digital Manufacturing Cloud tenants.
- LM integrates with OEE infrastructures of SAP Digital Manufacturing Cloud. The required configuration and associated master and transaction data should be already existing for SAP Digital Manufacturing Cloud OEE (event based).
- LM integrates with equipment. model, template, indicators, their associated master/transaction data of SAP Asset central Foundation (ACF) which is part of SAP Asset Intelligence Network (AIN). The required configuration and associated master and transaction data should be already existing for ACF/AIN.
- LM integrates with SAP Plant Connectivity (PCo). The required configuration, mapping, and associated master and transaction data should be already existing for PCo.
- LM works with SAP Digital Manufacturing Cloud process order only. Integration of Production Orders are out of scope in this release. Watch this space to get notified when Production Orders are also folded in, in LM.
- LM is tested and run in AWS and Azure only. Testing and running in other cloud providers like Ali Cloud is work in process and is not part of this SAP Digital Manufacturing Cloud release of 2111.
- Content of this blog post are for guidance purpose only. For full information on LM product, refer to the help and product documentation.
Personas
- IT Consultant: This persona has overall knowledge and skill on how to configure, design, publish, and run SAP Digital Manufacturing Cloud PODs (especially LM POD) using SAP Digital Manufacturing Cloud POD Designer.
- Production Supervisor: This persona is responsible to oversee and monitor production process and shall work with and use the LM POD deployed by above IT consultant.
Design, Configure, Publish
LM POD has to be designed and configured before it can be published and run. Following is the step-by-step guide on how to design and configure LM. I have tried to cover all steps but in case there is some confusion, missed opportunities etc., do let me know or contact your skilled IT consultant. This design is suggested way and customer can choose to design LM in different way as LM is built using set of plugins. Typically, at the end of this blog post, one shall get running LM POD looking like similar to this (illustration purpose only, as multiple perspectives or combined into one screen shot- ignore circled numbers as they are used to denote various perspectives and shall not be part of runtime of LM😞
As suggested above, typically, designing and publishing of Line Monitor POD is done by IT consultant who knows how to use POD Designer in SAP Digital Manufacturing Cloud. With SAP Digital Manufacturing Cloud release 2111 users will be able to find various plugins of LM and design, save, publish LM.
Please follow the steps below to publish LM POD. In each step, do save your work frequently to avoid losing it. Of course, first step would be to login into SAP Digital Manufacturing Cloud tenants (with all the necessary setup already done) with user ID which has all the necessary authorizations.
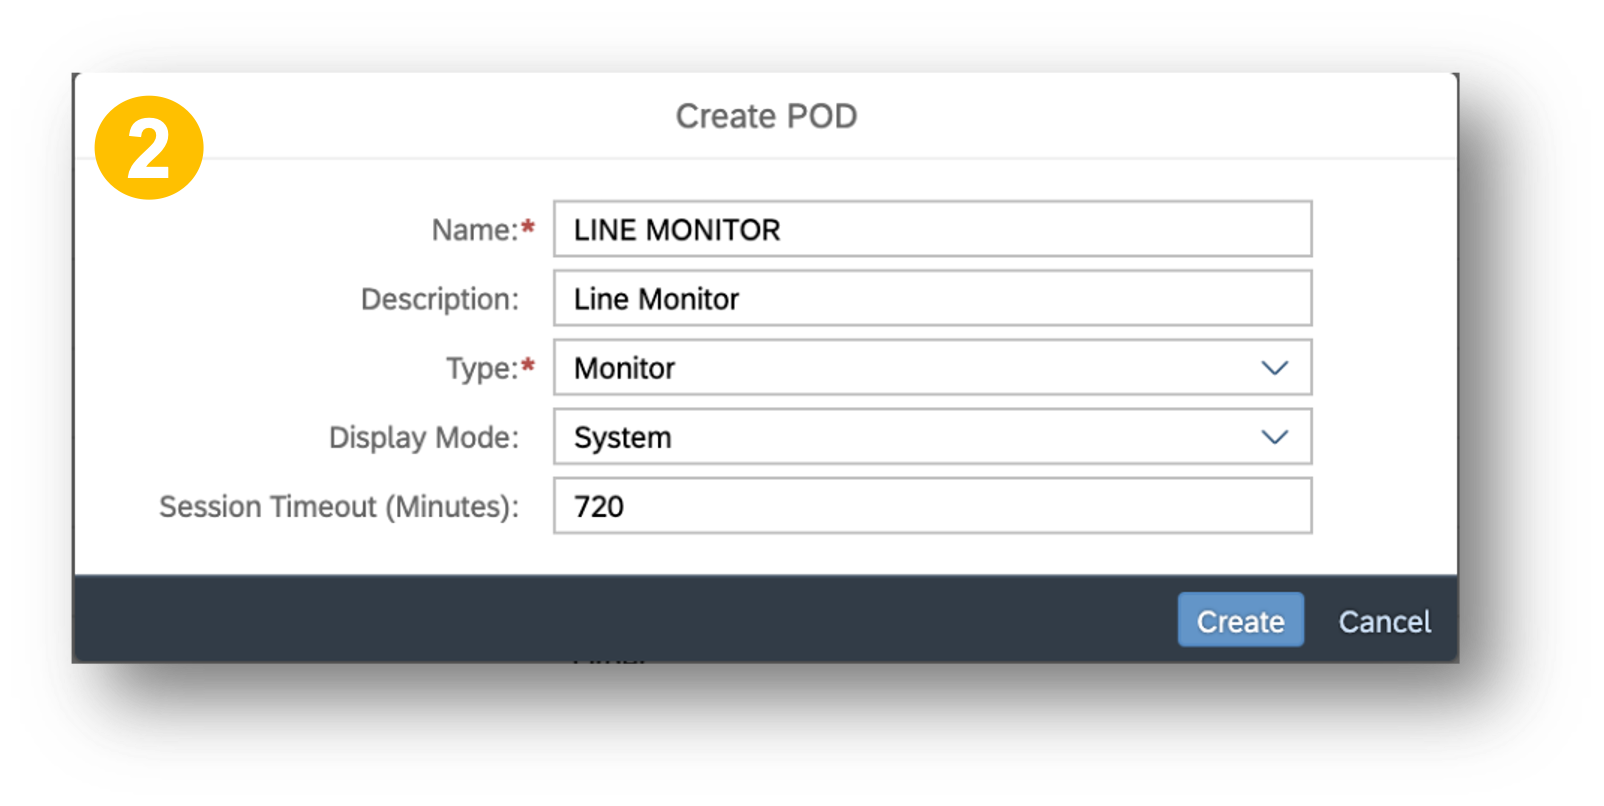
- Go to the POD Designer and start creating POD by clicking on “Create” button.

- Fill necessary details for the LM POD
- Check if all 15 plugins as listed below are shown.

- In the Toolbox section, ensure that Icon Tab Bar is listed in the Controls.

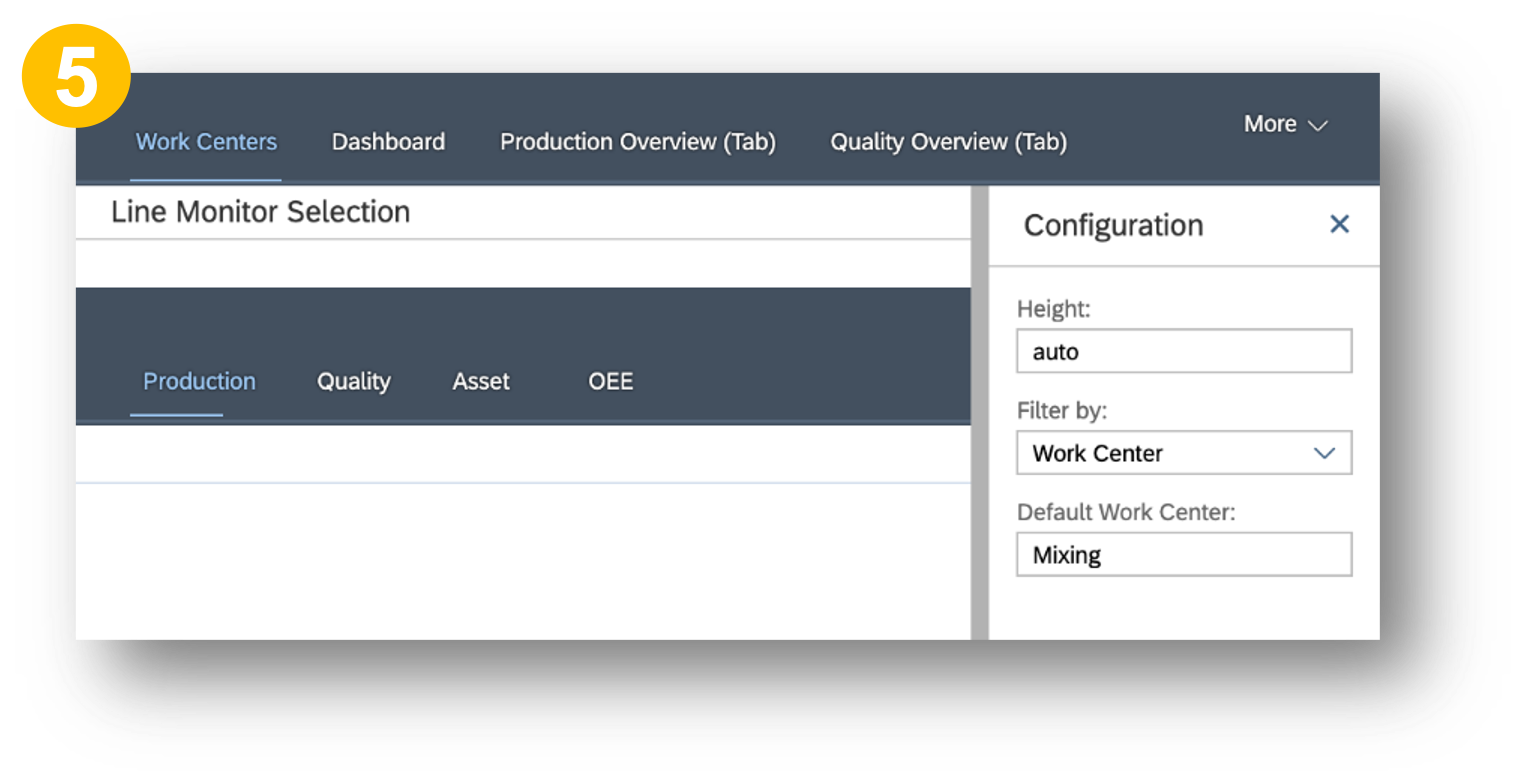
- In the POD Designer, Main Page is created automatically. Change its name to Work Centers. This shall hold overview of various perspectives. Add Line Monitor Selection Plugin with the configuration in the screenshot. Value in Default Work Center is optional.
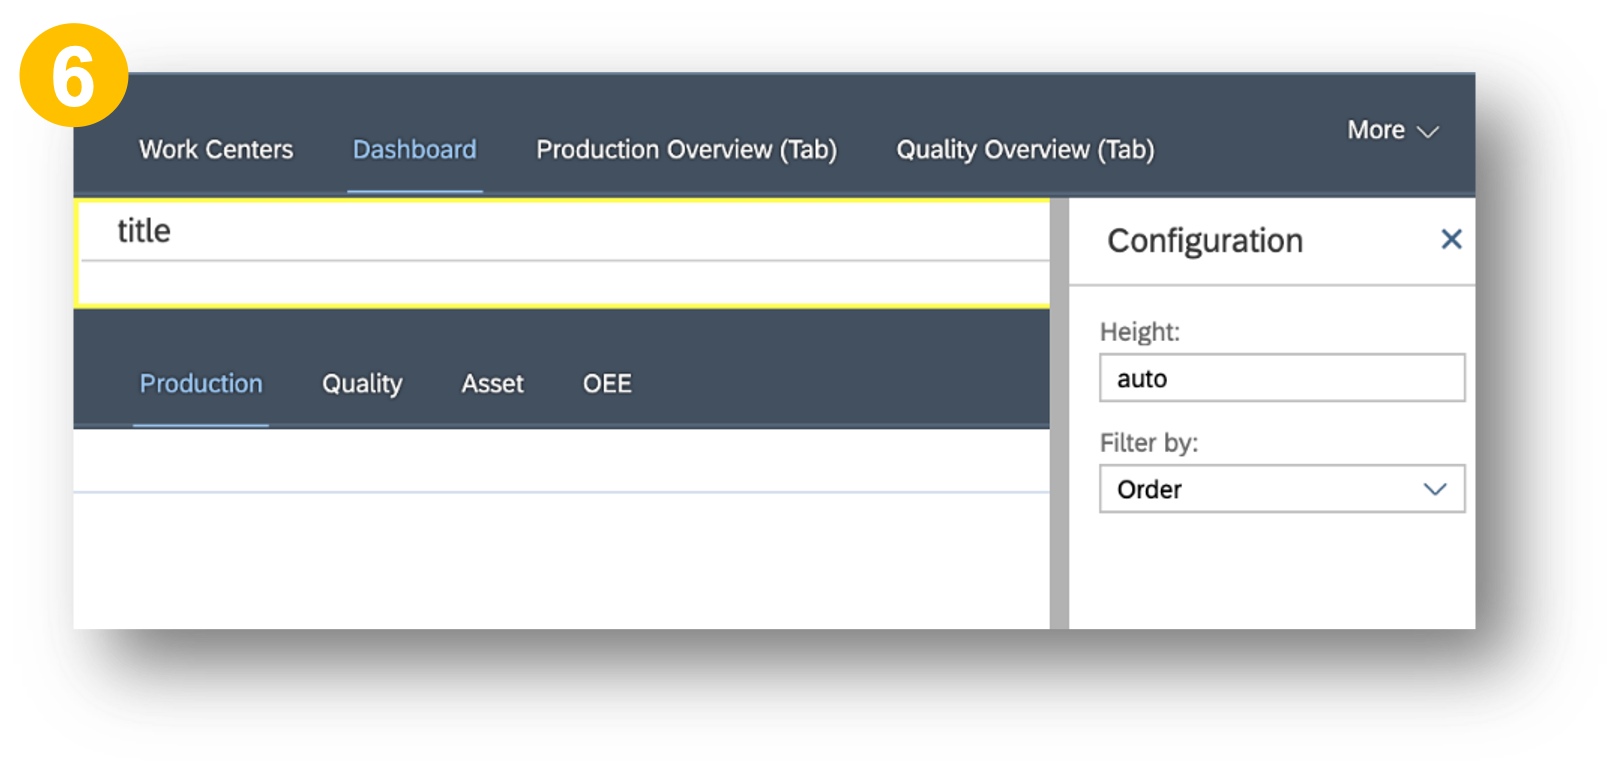
- Add another page “Dashboard” to hold detail view of various perspectives. You can do that using Page control of type Page.

- Sequentially add multiple pages of type Tab for Production, Quality, Asset, OEE. 2 pages of type Tab for each perspectives (one for overview and another for details)

- Create pages of type Tab as shown in the tab bar. Total 8 pages of type Tab needs to be created as shown (names above are suggested to indicate overview and detail perspectives)

- Production Overview (Tab): Use plugins (Line Monitor Overview Toolbar and Production Overview Plugin) and configurations as shown for Production Overview (Tab)

- Quality Overview (Tab): Use plugins (Line Monitor Overview Toolbar and Quality Overview Plugin) and configurations as shown for Quality Overview (Tab)

- Asset Overview (Tab): Use plugins (Line Monitor Overview Toolbar and Asset Overview) and configurations as shown for Asset Overview (Tab)

- OEE Overview (Tab): Use plugins (Line Monitor Overview Toolbar and OEE Overview) and configurations as shown for OEE Overview (Tab)

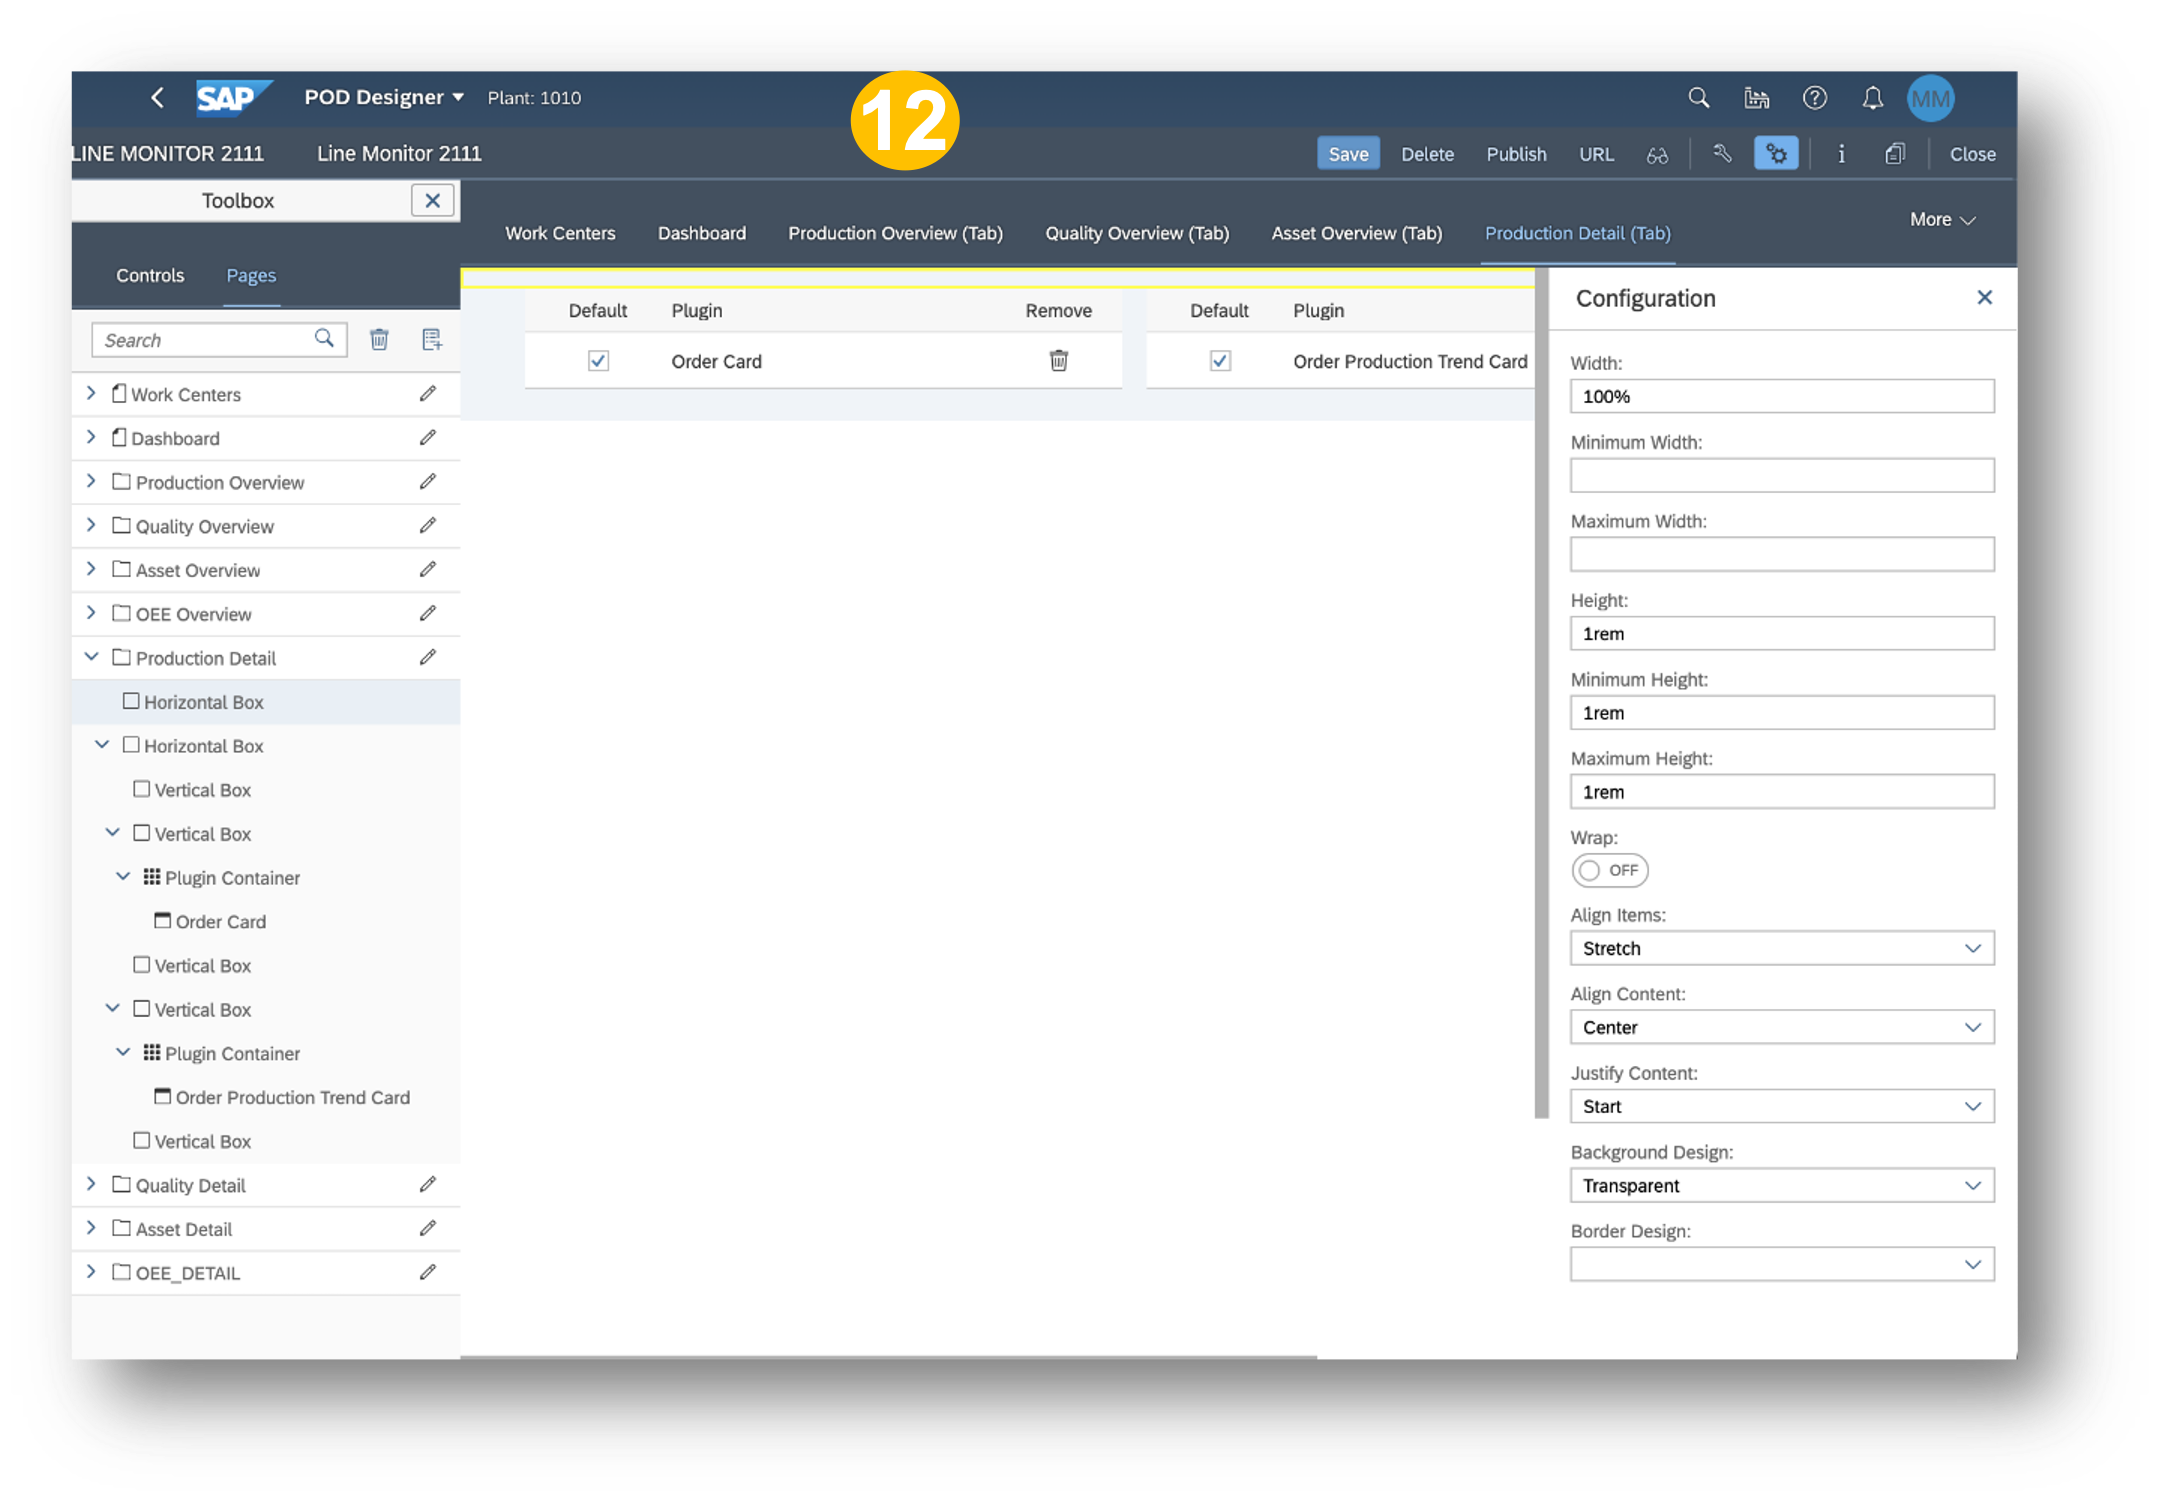
- Production Detail (Tab): Use plugins (Line Monitor Overview Toolbar, Order Card, and Order Production Trend Plugin) and configurations as shown for Production Detail (Tab)
- Quality Detail (Tab): Use plugins (Line Monitor Overview Toolbar, Yield and Scrap, and Indicator Chart Plugin) and configurations as shown for Quality Detail (Tab)

- Asset Detail (Tab): Use plugins (Line Monitor Overview Toolbar, Availability Plugin, Top 5 Availability Losses By Line, and Top 5 Availability Losses By Resources) and configurations as shown for Asset Detail (Tab)

- OEE Detail (Tab): Use plugins (Line Monitor Overview Toolbar, 4 OEE KPI plugins one each for OEE, Availability, Performance, Quality, Top 5 Availability Losses By Line, and Top 5 Performance Losses By Line) and configurations as shown for OEE Detail (Tab)

In the Work Centers Page, add Icon Tab Bar control and create 4 page containers to hold 4 overview perspectives as shown:
- Production: Link it to the Production Overview Tab

- Quality: Link it to the Quality Overview Tab

- Asset: Link it to the Asset Overview Tab

- OEE: Link it to the OEE Overview Tab

In the Dashboard, add Icon Tab Bar control and create 4 page container to hold 4 detail perspectives as shown:
- Production Detail: Link it to the Production Detail Tab

- Quality Detail: Link it to the Quality Detail Tab

- Asset Detail: Link it to the Asset Detail Tab

- OEE Detail: Link it to the OEE Detail Tab
- Publish: Clicking this Publish shall create tile in the SAP Digital Manufacturing Cloud dashboard for the just created and saved LM POD. Click this tile in SAP Digital Manufacturing Cloud dashboard shall show LM POD in run time.


- URL: Clicking this URL button shall fetch the URL for the just created and saved LM POD. Use this URL to view LM POD in run time, in a separate browser session.

- Preview: Clicking this Preview button shall open up another browser session and show the just created LM POD in run time.

- Open SAP Digital Manufacturing Cloud dashboard and click on the published tile of Line Monitor POD (Line Monitor 2111).

Run
- In the grid view of the Line Monitor POD, Time Range (Current Day or Since Previous Day) and Work Center(s) can be selected (in this example Since Previous Day and Mixing have been selected respectively). The shown Production Overview tile shall contain Current Order, Total Number of Orders, Total Number of Orders completed for selected work center. If there are more than one work centers are selected, then that many tiles will be shown with these info.

- Clicking on the production overview tile will take you to next screen showing details and progress of production for chosen work center and order in the selected time range. These info are shown by two plugins namely Order Summary and Production Progress.

- Quality Overview Tab: You shall see Work Center, Current Order(s), Planned Yield, % of Yield and Scrap for all active orders in the selected work center.

- Click on Quality tile to see detail view for a single order in given work center for chosen time range using two plugins. First one is Yield and Scrap showing Yield, % Yield Deviation, Scrap quantity for a phase at resource level. Second one is Sensor Data showing time series data for indicator(s) of sensor attached to equipment assigned to a resource with calculated Min, Max, Average values.

- In the overview grid page, go to Asset tab. You shall see Work Center and its aggregate status for assets within it.

- Click on Asset tile to see detail view. You shall see three plugins. These are Availability plugin at line level, Top 5 Availability Losses at line level, and Top 5 Availability Losses at resources level.

- This view also shows 3 plugins. Only difference is that availability chart is shown at resource level.

- In the overview grid page, go to OEE tab. You shall see Work Center and % KPIs of OEE, Availability, Performance, Quality.

- Click on OEE tile to see detail view. You shall see three plugins. These are Availability plugin at line level, Top 5 Availability Losses at line level, and Top 5 Performance Losses at line level.

- This view also shows 3 plugins. Only difference is that availability chart is shown at resource level.

Summary
As you might have already noticed, Line Monitor (LM) product of SAP Digital Manufacturing Cloud is a path breaking application for monitoring your production process for various perspectives (Production, Quality, Asset, OEE). This is the first time production supervisor can have plant level (and broken down to work center as needed) monitoring in place with integration to Process Orders. Configuration of LM is also super easy as it is based on WYSIWYG. Already configured and published LM can be copied across plants and tenants as well. Customer can also have their own plugins included side by side in this LM app, using already provided mechanism by SAP SAP Digital Manufacturing Cloud POD foundation framework. With more and more features coming in towards future releases, do watch this place for more updates.
As is clear, even the best of best products need enhancements, enrichments, upgrades to keep up with technology and ever changing customer requirements. In that context, I would welcome all the feedbacks, thoughts, comments, suggestions on product improvements/ new features from our esteemed readers, customer, partners, colleagues on this blog post of Line Monitor (LM). You may also use component MFG-DM-MI-LM to send your feedback (or for incident reporting) on the usage of LM.
I also would request and encourage you to follow tags and my profile to be first to know about latest and greatest on LM.
You can also look at QnA in following communities and ask questions as well (and don't forget to include tags of LM and Line Monitor in your question(s)):
SAP Digital Manufacturing Cloud
SAP Digital Manufacturing Cloud Insights
Again, thanks for reading this blog post and posting all the feedbacks, thoughts, comments, suggestions on product improvements/ new features.
Labels:
8 Comments
You must be a registered user to add a comment. If you've already registered, sign in. Otherwise, register and sign in.
Labels in this area
Related Content
- How to use Digital Manufacturing MDOs within PPD Example: Where-Used Report with Follow-up Actions in Product Lifecycle Management Blogs by SAP
- Error on setup of Discrete Production Orders in Order POD within SAP Digital Manufacturing in Product Lifecycle Management Q&A
- Meet PLM experts from SAP at Hannover Messe 2024 in Product Lifecycle Management Blogs by SAP
- Meet PLM experts from SAP at Hannover Messe 2024 in Product Lifecycle Management Blogs by SAP
- Striking the Perfect Balance in Product Lifecycle Management Blogs by SAP
Top kudoed authors
| User | Count |
|---|---|
| 2 | |
| 2 | |
| 2 | |
| 2 | |
| 1 | |
| 1 | |
| 1 |