In the blog post
ILM Advisor: “Optimising Memory Usage with ILM Objects: A Comprehensive Guide”, we have seen the introduction of our new application called ILM Advisor in SAP S/4HANA Cloud Public Edition.
In this blog, we will see the key features available in ILM Advisor as part of SAP S/4HANA Cloud Public Edition 2308.
Overview: -
Analysing & monitoring the memory consumed by the business data and logs is not possible in SAP S/4HANA Cloud Public Edition.
In SAP S/4HANA Cloud Public Edition 2308 a new self-service application called ‘ILM Advisor’ is available for administrator to monitor and analyse the memory consumption.
Prerequisite: -
You need to have the business role SAP_BR_ADMINISTRATOR (Administrator) to access the ILM Advisor application.
Accessing ILM Advisor application: -
The ILM Advisor application is available in the System Analysis section on the Technical Monitoring page.

Technical Monitoring

ILM Advisor tile
Key features of ILM Advisor application: -
Once you launch the application, the following page is displayed, which has an overview area and details area.

Overview area
The overview area focuses on the summary of the overall memory footprint in the tenant. Overview area is a combination of:
- Total memory Usage
- Analyzed Memory
- Non-Analyzed Memory
Let’s have a look at the topics in detail.
You will get to know how much memory of your current subscription is allocated by your business data (as-is situation).
A graphical visualization is displayed with
Licensed Memory and
Used Memory as two separate values and the delta (difference) will be reflecting either in green colour (if the memory is available) or in red colour (if the used memory exceeds the total memory).
Licensed Memory: -
Memory available/purchased as part of base licence of the subscription with Unit of Measure (UoM).
Used Memory: -
Memory consumed by the data with UoM.
When you hover over the graph area further details including Total Memory, Used Memory, Licensed Memory, and Delta Memory are available. Below is the screenshot of the Total Memory Usage graph upon hovering.
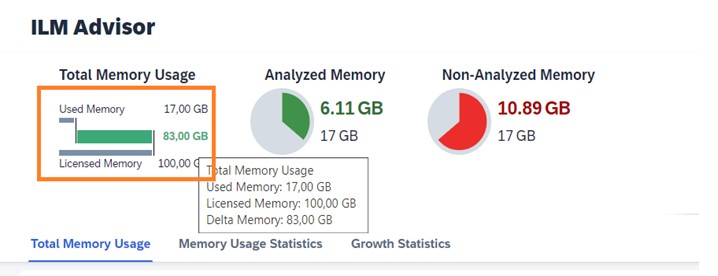
Hover over Total Memory Usage
A graphical visualization is displayed with
Used Memory and
Analyzed Memory as two separate values. Analysed Memory is in green colour.
Analyzed Memory: -
The common top-growing tables have been identified. ILM objects (note:- AIF_MES, BC_SAL, BC_SBAL, CA_BUPA, FI_DOCUMENT, EQM_FLOW, MM_EKKO, MM_MATBEL, SD_VBAK, & SD_VBRK are the ILM objects considered. ) that contribute to these top growing tables are considered for analysing the memory consumption footprint, and the sum of these memory is termed as Analysed Memory.
When you hover over the Analysed Memory graph, Additional details such as Analyzed Memory and Used Memory are available. Below is the screenshot of the Analyzed Memory graph area.
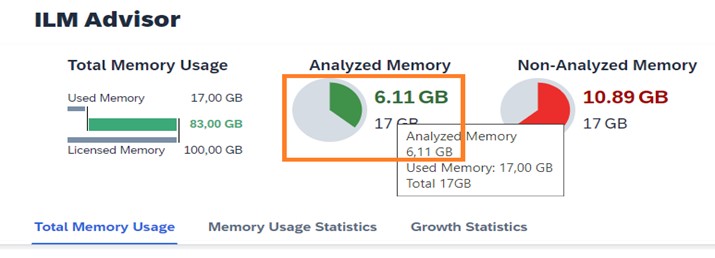
Hover over on Analyzed Memory
This is a graphical visualization with
Used Memory and
Non-Analyzed Memory as two separate values. Non-Analysed Memory is in red colour.
Non-Analyzed Memory: -
Memory size resulting on subtracting Analyzed memory from Used Memory.
When hover over the Non-Analysed Memory graph, Additional details such as Non-Analyzed Memory and Used Memory are available. Below is the screenshot of the Analyzed Memory graph area.

Hover over on Non-Analysed Memory
The detail area contains memory analysis in three categories.
- Total Memory Usage
- Memory Usage Statistics
- Growth Statistics
We will see each topic in detail below.
This tab provides a comprehensive history and details of the memory consumed for analysed ILM objects. This is a bar graph representation of cumulative used memory size for the previous 18 months - with the months on X-axis and memory size UoM on Y-axis.

Total Memory Usage
This tab provides transparency on data reduction potential for significant data consumers related to ILM objects using simulation. It also helps users in identifying and focusing on the most relevant ILM objects for memory reductions.
This is the list of ILM objects in terms of memory consumption with the below field.
Field name |
Information conveyed by this field |
ILM Object |
ILM object ID |
Description |
ILM object Name |
ILM Object Memory size (UoM) |
Memory consumed by this ILM object |
Residence Time (Months) |
Residence duration in months |
Time-Based Potential (UoM) |
Based on Residence Time, this field give information on the size of memory that potentially could be set free if the ILM process executed with the given residence time. |

Memory Usage Statistics
Here there is a flexibility to customers to check the possible amount of memory that could be freed up by modifying the Residence Time field. The data can be modified by using ‘+’ and ‘- ‘button in each row or by entering the value directly in the field.
Note: -
- Residence time has been limited to the 1-18 range.
- This Residence time is not integrated with the ILM residence time.
The application features a list that ranks ILM service objects based on memory changes in the preceding three months by default. This is the table of top-growing ILM objects in terms of memory consumption with the following fields.
Field name |
Information conveying |
ILM Object |
ILM object ID |
Description |
ILM object Name |
Rank |
Position of the ILM object with respect to memory consumption |
Change in Memory |
Percentage wise memory growth for given duration |
Change in Memory (UoM) |
Memory growth for given duration |
Memory Used (UoM) |
Total memory consumed per ILM object |

Growth Statistics
On the top-right corner of the list view, there is a filter option. This option provides you with the flexibility to see the growth of memory consumption for the previous 18 months (3, 6, 9, 12, & 18 months).
Conclusion: -
ILM Advisor application helps you to understand the memory consumed by the application data and to make an informed decision on how to identify the ILM-enabled archiving object and archive the data to reduce the memory footprint.
