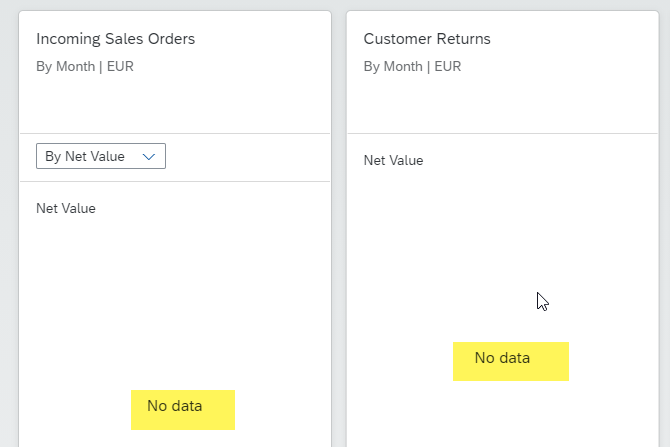
Question 1: What to do if graphical display does not work in analytical apps?
When you attempt to enable graphical display in a Web Dynpro-based analytical app (for example,
Incoming Sales Orders - Flexible Analysis), no data is shown.
- Warning message: "Chart cannot be rendered: Too many data points"

If the volume of data in "Data Analysis" is too large, graphical display would not work due to performance risks. Apply filters in "Data Analysis" to reduce data first.
- Warning message: "Chart cannot be rendered: Multiple units for measure REF_QV_CELL_5"
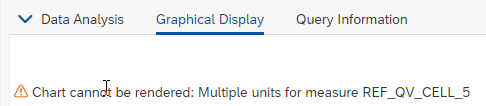
Graphical Display can only show data with a uniform unit of measure. Check if there is an asterisk (*) in your table, which means different units for this field. You can apply filters to unify units for the following fields:
- For quantity fields, e.g., Incoming Orders Qty, "*" means different units for products.
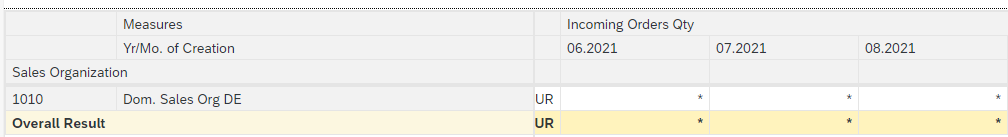
2. For value/amount fields, e.g.
Net Value, "*" means there are different currencies.

You can refer to help document for
Currency Exchange Rates and blog
Maintain translation ratios for Currency pair to maintain exchange rates between the transaction currency and display currency.
Question 2: What to do if table/chart preview does not work in analytical or apps or CDS views?
One possible cause is unmaintained currency conversion rates. Such preview errors may occur in analytical cubes or overview page (OVP) apps.
- Cubes (including custom cubes)
In analytical cubes (e.g.,
I_SalesOrderItemCube), an error is raised if the currency exchange rate has not been maintained. For example, before exposing an amount in display currency (e.g.,
IncomingSalesOrdersNetAmtInDC), you need to maintain all used currency conversion rates.

Note: Such preview errors would not occur in analytical queries/reports (where the original transaction amount and currency can be properly shown) if currency exchange rates are not maintained.
For example, charts cannot be loaded in the
Sales Management Overview app.
No message is reported, but you can use the following method to check whether the preview error is caused by missing currency exchange rates.
In Chrome, press F12 to open the dev tools. Open the OVP app on the same page and switch to tab "Console". You can find an error message like below.

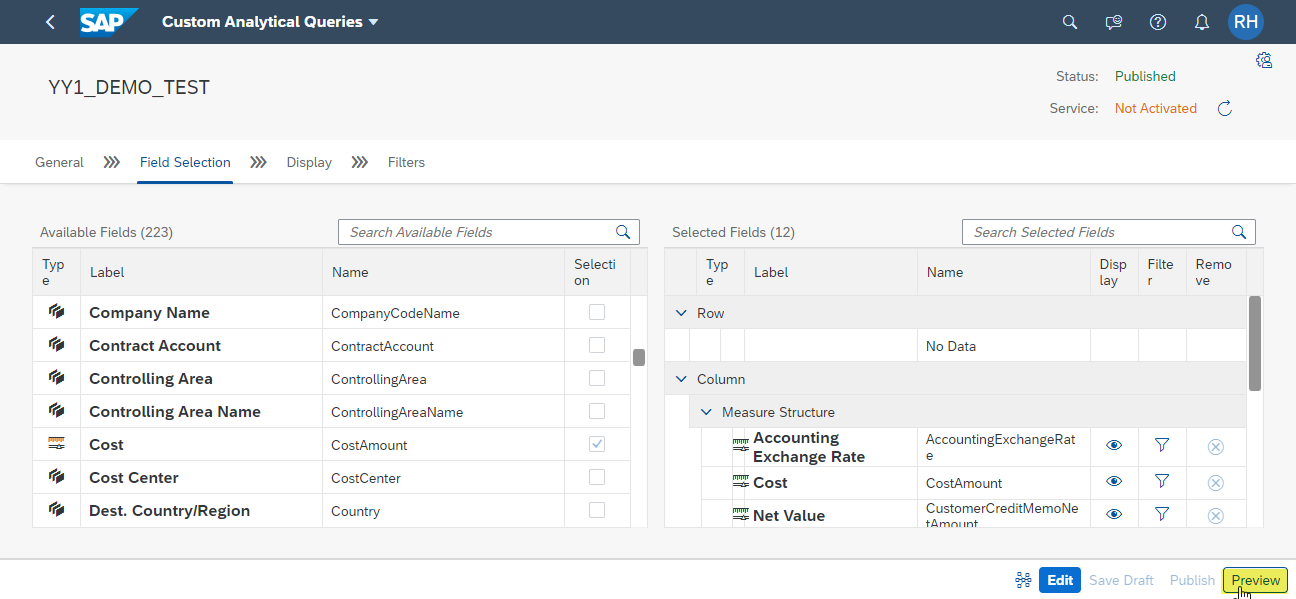
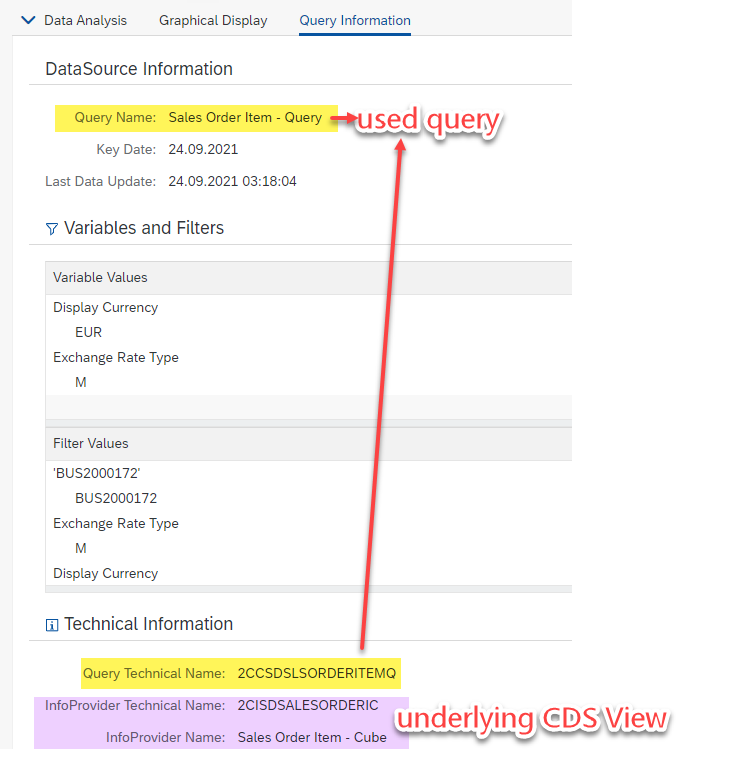
Question 3: How can I know which CDS views are used in analytics apps?
On tab "Query Information", you can find the query name and underlying cube information. Take app
Incoming Sales Orders - Flexible Analysis as an example. The query and underlying CDS view are listed.
- Query: Sales Order Item - Query (2CCSDSLSORDERITEMQ)
- Underlying cube: Sales Order Item - Cube (2CISDSALESORDERIC)
To view more details, you can search by view name (for example,
Sales Order Item - Query) in
CDS Views for Sales on SAP Help Portal. You can also find the underlying CDS View of query in the
View Browser app(business role template
SAP_BR_ANALYTICS_SPECIALIST).

Some frequently used apps/queries and their undelaying cubes:
App |
Query |
Underlying Cube |
Incoming Sales Orders - Flexible Analysis |
C_SalesOrderItemQry |
I_SalesOrderItemCube |
Sales Volume - Flexible Analysis |
C_RevenueFromInvoiceQry |
I_BillingDocumentItemCube |
Customer Returns - Flexible Analysis |
C_CustomerReturnItemQry_2 |
I_CustomerReturnItemCube_2 |
Sales Quotations - Flexible Analysis |
C_SalesQuotationItemQry |
I_SalesQuotationItemCube_2 |
Example:
Quotation Conversion Rates - Valid/Not Completed,
Sales Volume - Check Open Sales
If you use Chrome, press F12 to open the dev tools. Open the app on the same page. You can see all requests on tab "Network". Search on "batch" and look for the CDS view ID that precedes "_CDS/$batch?sap-client".

Question 4: What to do if I cannot find wanted measures or dimensions in queries or analytics apps?
Not all the dimensions and measures from underlying cubes are exposed in standard queries. If you cannot find measures or dimensions in analytics apps or queries, you can check if they exist in underlying cubes or other cubes in the
View Browser app (business role template
SAP_BR_ANALYTICS_SPECIALIST).
If your desired dimensions or measures can be found in a cube but are not exposed, please create your own queries by referring to blog
How to build a Custom Analytical Query.
Question 5: What to do if downloading EXCEL from Design Studio apps fails?
Example:
Sales Quotations - Flexible Analysis,
Customer Returns - Flexible Analysis
Note: Design Studio apps in Sales were deprecated in SAP S/4HANA Cloud 2105 and removed from the system with SAP S/4HANA Cloud 2111. Although you can continue to use custom Design Studio apps, they cannot be migrated automatically to Web Dynpro apps. We recommend that you recreate them as Web Dynpro reports.
In a Design Studio app that has been created based on your custom query, an out-of-memory error may occur when you download data into an EXCEL file. According to Note
2557541 - Configuration of amount of data to retrieve from server, the amount of retrieved data in Design Studio apps is restricted as follows:
- Rows are restricted to 10.000
- Columns are restricted to 50
To solve the issue, you can try the following:
- Reduce the number of dimensions or set more filters to limit the data volume.
- In the Custom Analytical Queries app, rebuild a Web Dynpro app based on your custom query. You can refer to blog How to build a Custom Analytical Query