
- SAP Community
- Products and Technology
- CRM and Customer Experience
- CRM and CX Blogs by SAP
- Using Dynatrace to Manage and Optimize the Perform...
CRM and CX Blogs by SAP
Stay up-to-date on the latest developments and product news about intelligent customer experience and CRM technologies through blog posts from SAP experts.
Turn on suggestions
Auto-suggest helps you quickly narrow down your search results by suggesting possible matches as you type.
Showing results for
Product and Topic Expert
Options
- Subscribe to RSS Feed
- Mark as New
- Mark as Read
- Bookmark
- Subscribe
- Printer Friendly Page
- Report Inappropriate Content
05-12-2023
5:38 AM
Overview

With SAP Commerce Cloud, Dynatrace comes embedded as part of every subscription giving you access to a powerful set of tools to analyze and optimize the performance of your site. In this article we cover the useful features of Dynatrace and how you can leverage them to troubleshoot performance issues.
Contributors: yannick.robin , daniel.norberg, jdhickey
What is Dynatrace
Dynatrace is an Application Performance Monitoring (APM) tool to seamlessly bring together infrastructure, application performance, and digital experience monitoring into an all-in-one, automated solution that's powered by artificial intelligence. Dynatrace assists in driving performance results by providing development, operations, and business teams with a shared platform. Agents are deployed across all nodes in your SAP Commerce Cloud application, giving you insight into your services, JVM, OS and database.
Dynatrace should not be used for the following:
- Analysis of large logs - Kibana should be used for analyzing your logs. You can also set up alerts for logs as covered in Developing SAP Commerce Cloud Locally.
- End user analytics - if you're trying to review analytics on how users are experiencing your site (e.g. conversion rates) then you may chose to purchase the Dynatrace Digital Experience Monitoring solution or choose to Implement Google Analytics.
- Synthetic testing - To understand the true responsiveness of your site you can purchase the Dynatrace Digital Experience Monitoring solution or look at integrating other solution providers (e.g. Pingdom, Uptime Robot).
- Understand Service Level Agreement (SLA) metrics
Accessing Dynatrace
Dynatrace can be accessed via the Cloud Portal (https://portal.commerce.ondemand.com/ ). In Cloud Portal, first select your subscription, then select the environment you wish to analyze. On each environment page you will see a "Monitoring" section which has an icon to open up Dynatrace. For more details and other options for accessing Dynatrace, please see this page or watch the following video:
https://enable.cx.sap.com/media/How+to+Access+Dynatrace+-+SAP+Commerce+Cloud/1_5i0xt6zz
Data Retention
Before getting started you should be familiar with the data retention periods for Dynatrace. The SAP service data retention policy allows you to preserve critical information about your system performance, ensuring accurate readings and analysis. The standard Dynatrace data retention policy is as follows (measured in calendar days):
- Code-level data: 10 days
- Service-level data: 14 days
The transactional data storage capacity depends on the type of environment:
- Stage/Development environments: 10 GB
- Production environments: 100 GB
If you exceed this upper storage limit before the time periods expire, the system truncates older data by reducing its granularity to make space until the retention time periods expire. If needed, you can purchase extra storage capacity. Contact Support for more information.
For each time series, the data granularity decreases as the retention period expires: the periods of time for each data chunk get longer, reducing their precision. For example, if your data was originally sampled every 30 seconds, the archived data would start with the data sampled every minute, then every five minutes, then every hour, then every day.
Therefore, the system archives the data as follows:
- 0–14 days: Data recorded every minute
- 15–28 days: Data recorded every five minutes
- 29–400 days: Data recorded every hour
- 401 days–five years: Data recorded every 24 hours
Getting Started
Before proceeding it is recommended to review the features and capabilities in Dynatrace by consulting the Dynatrace section of the product documentation. You should ensure you're comfortable with:
- Setting up alerts (link). If you require alerts via email please contact SAP Support.
- Understanding service flows (link).
- Viewing existing dashboards and creating your own (link).

Troubleshooting Scenarios
In this section we'll walk you through some common problems and how you might go about using Dynatrace to find a resolution.
Website feels slow
Option #1
- Click on the "Problems" in the sidebar.
- Look for problems that have "response time degradation".
- Click on the problem and analyze findings.


Option #2
- Once you have resolved all the problems, click on the "Hosts" option in the sidebar.
- Select one of the hosts.
- Review any problems and repeat with remaining hosts.


Heavy Load on the Database
Option #1
- Click on the "Diagnostics Tools" option in the sidebar.
- Select "Top database statements".
- Select the time period with the high database load.
- Find the statement causing high execution and click on the "..." icon.
- In the popup select "service backtrace" to identify which service executed the query.

Option #2
- Click on the "Databases" option in the sidebar.
- Select your database.
- Adjust your timeframe to when the issue occurred and select the item from "Hotspots" section.
- Find the statement causing high execution and click on the "..." icon.
- In the popup select "service backtrace" to identify which service executed the query.

Specific Page is Failing
- Click on the "Transactions and services" option in the sidebar.
- Select your storefront service.
- Under the "Requests" section, select either "Response Time" or "Failure Rate" options.
- In the "Filtered by" box, add a new option for "web request URL" and set the value to your page (e.g. /sale) and look for high response and/or failures.
- Find the statement causing high execution and click on the "..." icon.
- In the popup select "service backtrace" to identify which service executed the query.
- Alternatively in the popup you can select "Method Hotspots" and filter on particular method calls (e.g. "Populator").

Random Users are Facing Failures with a Feature
- Click on the "Diagnostics tools" option in the left sidebar.
- Click "Exception Analysis".
- Filter on the request that is failing (e.g. /cart/add).
- Select the most interesting exceptions from the list.
- Click "go to exception details" button to get more details. Alternatively you can select the "..." item and view the PurePath or Service Backtrace options to identify the root cause.
Analyzing CPU
- Click on Diagnostic tools.
- Click on CPU Analysis.
- Under the "Process Groups" search by the Service you want to analyze (e.g. tomcat accstorefront-* ) and select from the list.
- Select yacceleratorstorefront.
- Click on Service request CPU > Show code level.
- Filtered by thread state: code execution.
Display Top Pages
- Click on Transactions & services.
- In the "Filtered By" box select "Process Group" and then choose the Service you want to analyze (e.g tomcat accstorefront-* ).
- In this example we're looking at the storefront, so we would select the name of the storefront extension (e.g. yacceleratorstorefront).
- Under the "Dynamic web requests" section of the page select any of the following:
- Click on Response time tab to get the top pages per contribution of time.
- Click on CPU tab to get the top pages per contribution of CPU.
- Click on Throughput tab to get the top pages per execution.
How to Identify Hotspots
- Perform the same steps as in the "Display top pages" section above.
- Update the duration of the analysis (from 5 to 15 min).
- Click on View method hotspots.
How to Download Logs
Although using Kibana is the recommended option for viewing centralized logs, the following is an option.
Currently only standard analytics of logs is available. This allows on-demand views of single log files for the past 7 days (limited to 500MB). This service is free and available to all customers.
- Click on Logs option in the sidebar.
- Select Kubernetes node containing the service.
- Select process (ex: tomcat accstorefont-*).
- Click on Download log files.
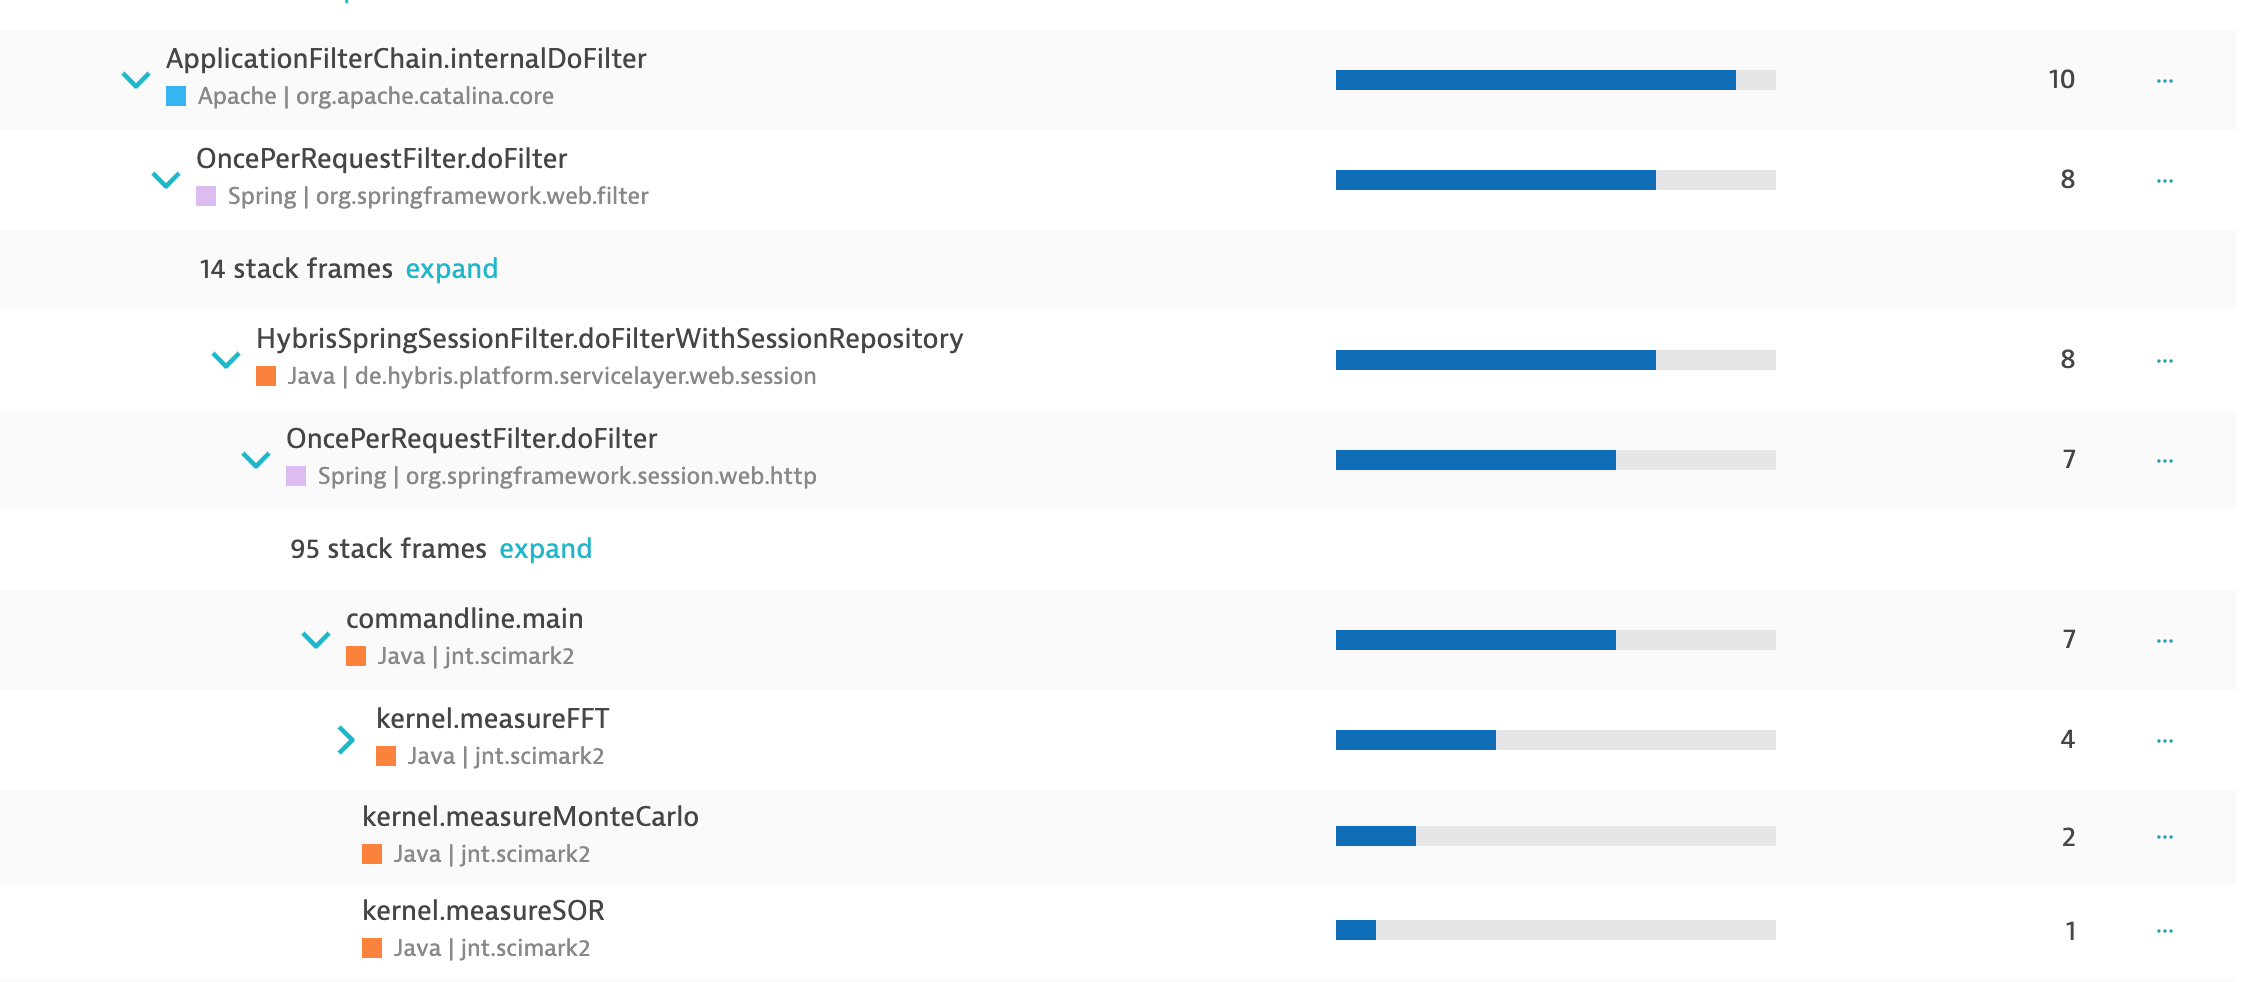
How to Analyze Threads
Thread dumps aren't required as Dynatrace supports continual thread analysis. To view the analysis, do the following:
- Click the Diagnostic Tools option from the sidebar.
- Select CPU Analysis.
- Search and find the process group (e.g. tomcat backgroundprocessing-*) you're looking for.
- Click on the "..." under the Actions column and select Threads.
- Select the timeline you want to analyze.
- Select the thread group to dig deeper into.
- Find the thread to analyze, click on the "..." under the Actions column and select Method Hotspots.

Exporting Data from Dynatrace
If you're looking to export data from Dynatrace via Application Programming Interface (APIs), unfortunately this is not a feature that is available. You are free to download data where the option presents itself in dynatrace (e.g. logs), otherwise you need to use Dynatrace for analyzing the performance of your SAP Commerce Cloud solution.
Conclusion
You should now have a high level overview of how to use Dynatrace. If you're looking to improve the performance of your site feel free contact SAP Expert Services.
- SAP Managed Tags:
- SAP Commerce,
- SAP Commerce Cloud
Labels:
1 Comment
You must be a registered user to add a comment. If you've already registered, sign in. Otherwise, register and sign in.
Labels in this area
-
Business Trends
270 -
Business Trends
11 -
chitchat
1 -
customerexperience
1 -
Event Information
256 -
Event Information
18 -
Expert Insights
30 -
Expert Insights
49 -
Life at SAP
133 -
Life at SAP
1 -
Product Updates
666 -
Product Updates
26 -
SAP HANA Service
1 -
SAPHANACloud
1 -
SAPHANAService
1 -
Technology Updates
453 -
Technology Updates
15
Related Content
- Clean Core within SAP Sales and Service Cloud extensions in CRM and CX Blogs by Members
- SAP Commerce Best Practices for Performance in CRM and CX Blogs by SAP
- SAP Commerce Cloud Q1 ‘24 Release Highlights in CRM and CX Blogs by SAP
- Maximize Results and Drive Sustainability in Fashion Retail with SAP and GK AIR Dynamic Pricing in CRM and CX Questions
- How to Retrieve Key Performance Metrics from SAP ASE / Sybase Instances? in CRM and CX Questions
Top kudoed authors
| User | Count |
|---|---|
| 5 | |
| 2 | |
| 1 | |
| 1 | |
| 1 | |
| 1 | |
| 1 | |
| 1 | |
| 1 | |
| 1 |