
- SAP Community
- Products and Technology
- CRM and Customer Experience
- CRM and CX Blogs by SAP
- Harnessing the Power of Data: Visualising Sales an...
CRM and CX Blogs by SAP
Stay up-to-date on the latest developments and product news about intelligent customer experience and CRM technologies through blog posts from SAP experts.
Turn on suggestions
Auto-suggest helps you quickly narrow down your search results by suggesting possible matches as you type.
Showing results for
Employee
Options
- Subscribe to RSS Feed
- Mark as New
- Mark as Read
- Bookmark
- Subscribe
- Printer Friendly Page
- Report Inappropriate Content
11-01-2023
7:22 PM
Here is a guide to the SAP Standard Delivered User Stories in Sales and Service Cloud Version 2. User Stories help in visualising and transforming raw data into actionable insights, and we provide you the possibility of using these stories as template and ensure you harness their full potential.
The Opportunity Pipeline dashboard provides a comprehensive snapshot of your sales landscape. Briefly, you get a synthesized view of the pipeline, segmented by various accounts and geographical regions. Coupled with real-time monitoring features, this dashboard categorizes opportunities based on their status, progress, and projected closure dates. It also highlights the top-performing sales representatives, enabling a closer look at customer behaviour and identifying high-potential areas or clients. With automatic updates scheduled for the next release, this tool ensures you're always one step ahead, channelling your sales efforts where they matter most.
The Sales Performance Dashboard provides a detailed perspective of both individual and collective sales achievements, segmented by industry and account. This tool not only tracks key sales metrics like total deals won/lost, win/loss ratios, and average deal sizes but also celebrates top-performing representatives by spotlighting their accomplishments. By analysing deal values, closure rates, and overall success metrics, it empowers you to refine your sales strategies, pinpointing any bottlenecks and uncovering areas ripe for enhancement. And with automatic updates in the pipeline for the next release, this dashboard ensures that your insights remain fresh and actionable.
The Case Insights dashboard is for businesses navigating the complexities of case management. It offers a holistic view of ongoing cases, categorizing them by source, priority, account, and type. Beyond just giving an overview, it sharply identifies unassigned and escalated cases, ensuring they don't fall by the wayside. But it doesn't stop there. The dashboard also aids in recognizing growth channels and potential staffing needs. In essence, Case Insights is an invaluable tool, translating intricate data into meaningful, actionable insights for efficient management.
The Agent Performance dashboard is a dedicated tool for closely monitoring agent and team efficiency. It zeroes in on agent workloads, comparing the number of cases they manage with their varying stages and priorities. By understanding this, the dashboard helps ensure tasks are evenly distributed among agents, highlighting both the top-performers and those who might need more support. These insights are invaluable for targeted training and boosting overall team performance, ultimately leading to a higher case completion success rate.
The case escalation metrics dashboard is a crucial asset for Service Managers seeking precision in their oversight. It delves meticulously into specific cases or accounts, illuminating pressing customer concerns. By presenting the current open case workload, this dashboard empowers you to prioritize and probe problematic cases based on their type and source. Moreover, it underscores the significance of escalated accounts, sharpening focus on the channels through which such cases emerge. Beyond mere awareness, escalating cases or accounts streamlines communication about pressing issues and ensures a clear path to monitor progress towards their resolution.
The SLA dashboard offers a deep dive into the efficiency and punctuality of case resolutions against the benchmarks set by Service Level Agreements (SLAs). Central to its design is the timeline feature, which illuminates the sequence of case updates and the key triggers influencing SLA compliance throughout a case's lifecycle. By highlighting critical attributes like 'Initial Review Due On', 'Initial Response Due On', 'Initial Resolution Due On', and 'Completion Due On', the dashboard underscores the importance of timely resolutions. This becomes paramount, as the time taken to address issues directly impacts the overall customer experience, making the SLA dashboard an essential tool for maintaining high service standards.
Our dashboards and analytics tools are designed to help customers achieve their business objectives by offering in-depth insights and data-driven guidance. Here’s how you can harness these visualisations to transform your operational strategies and achieve improved results:
SAP Sales and Service Cloud offer embedded analytics capabilities that empower users to access, create, and manage stories within SAP Analytics Cloud (SAC). This integration grants all users access to an embedded SAC instance, facilitating data analysis from various sources.
SAP Analytics Cloud, Embedded Edition, offers the following features within the system:
Here are some limitations to be aware of regarding analytics in the system:
Follow these steps to begin creating SAC stories and data models:
Our visualisations are more than just tools; they're gateways to actionable insights. By understanding and leveraging them, you're not just viewing data; you're crafting a roadmap to success. As you navigate these dashboards, remember: every data point is an opportunity, every insight a step forward. Dive in, explore, and let data-driven decisions shape your success story.
Diving into the Sales Cloud:
Opportunity Pipeline Overview:
The Opportunity Pipeline dashboard provides a comprehensive snapshot of your sales landscape. Briefly, you get a synthesized view of the pipeline, segmented by various accounts and geographical regions. Coupled with real-time monitoring features, this dashboard categorizes opportunities based on their status, progress, and projected closure dates. It also highlights the top-performing sales representatives, enabling a closer look at customer behaviour and identifying high-potential areas or clients. With automatic updates scheduled for the next release, this tool ensures you're always one step ahead, channelling your sales efforts where they matter most.

Opportunity Pipeline Overview
Sales Performance Overview:
The Sales Performance Dashboard provides a detailed perspective of both individual and collective sales achievements, segmented by industry and account. This tool not only tracks key sales metrics like total deals won/lost, win/loss ratios, and average deal sizes but also celebrates top-performing representatives by spotlighting their accomplishments. By analysing deal values, closure rates, and overall success metrics, it empowers you to refine your sales strategies, pinpointing any bottlenecks and uncovering areas ripe for enhancement. And with automatic updates in the pipeline for the next release, this dashboard ensures that your insights remain fresh and actionable.
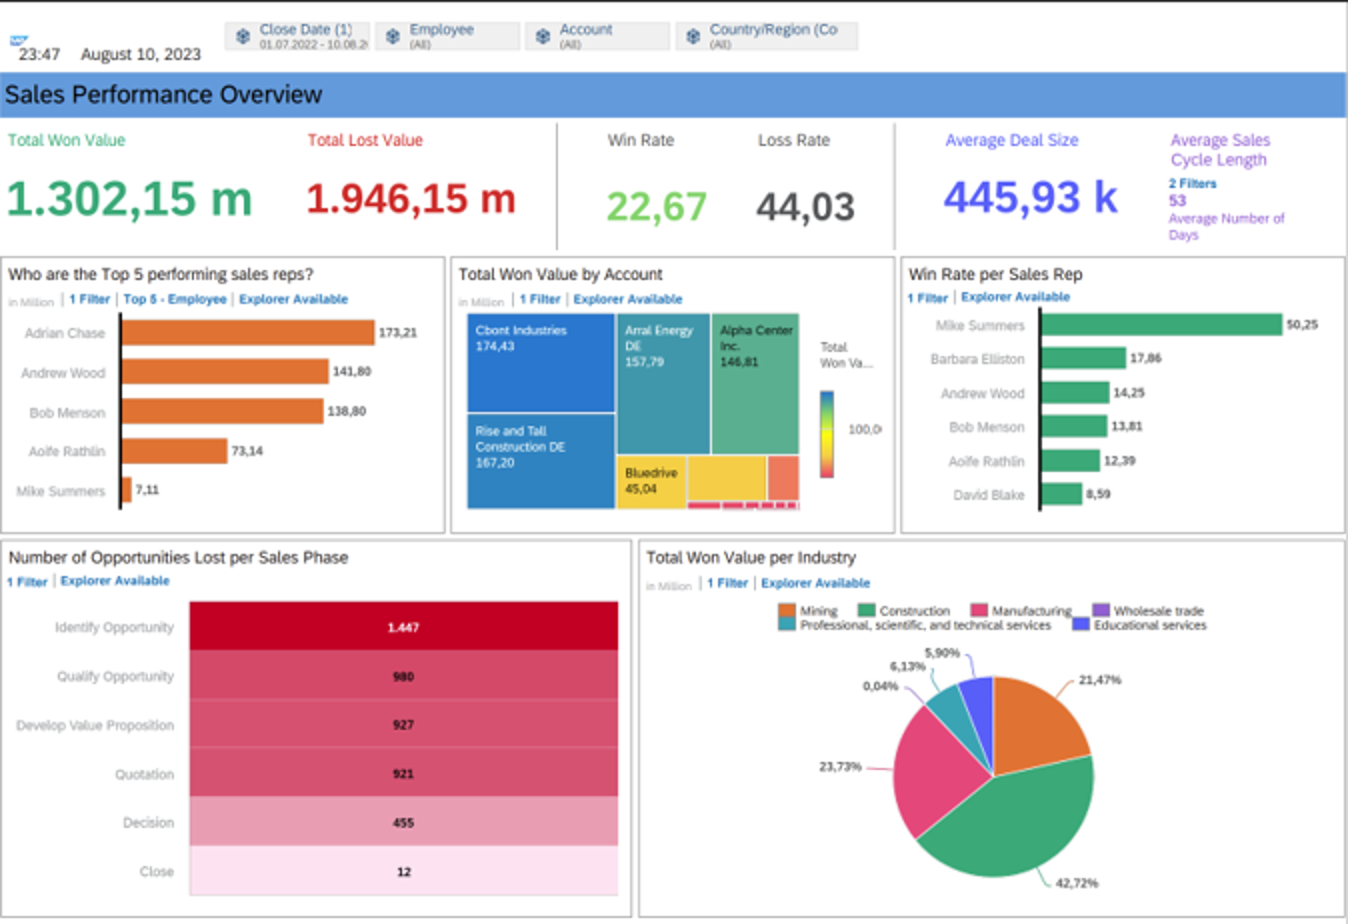
Sales Performance Overview
Exploring the Service Cloud:
Case Insights:
The Case Insights dashboard is for businesses navigating the complexities of case management. It offers a holistic view of ongoing cases, categorizing them by source, priority, account, and type. Beyond just giving an overview, it sharply identifies unassigned and escalated cases, ensuring they don't fall by the wayside. But it doesn't stop there. The dashboard also aids in recognizing growth channels and potential staffing needs. In essence, Case Insights is an invaluable tool, translating intricate data into meaningful, actionable insights for efficient management.
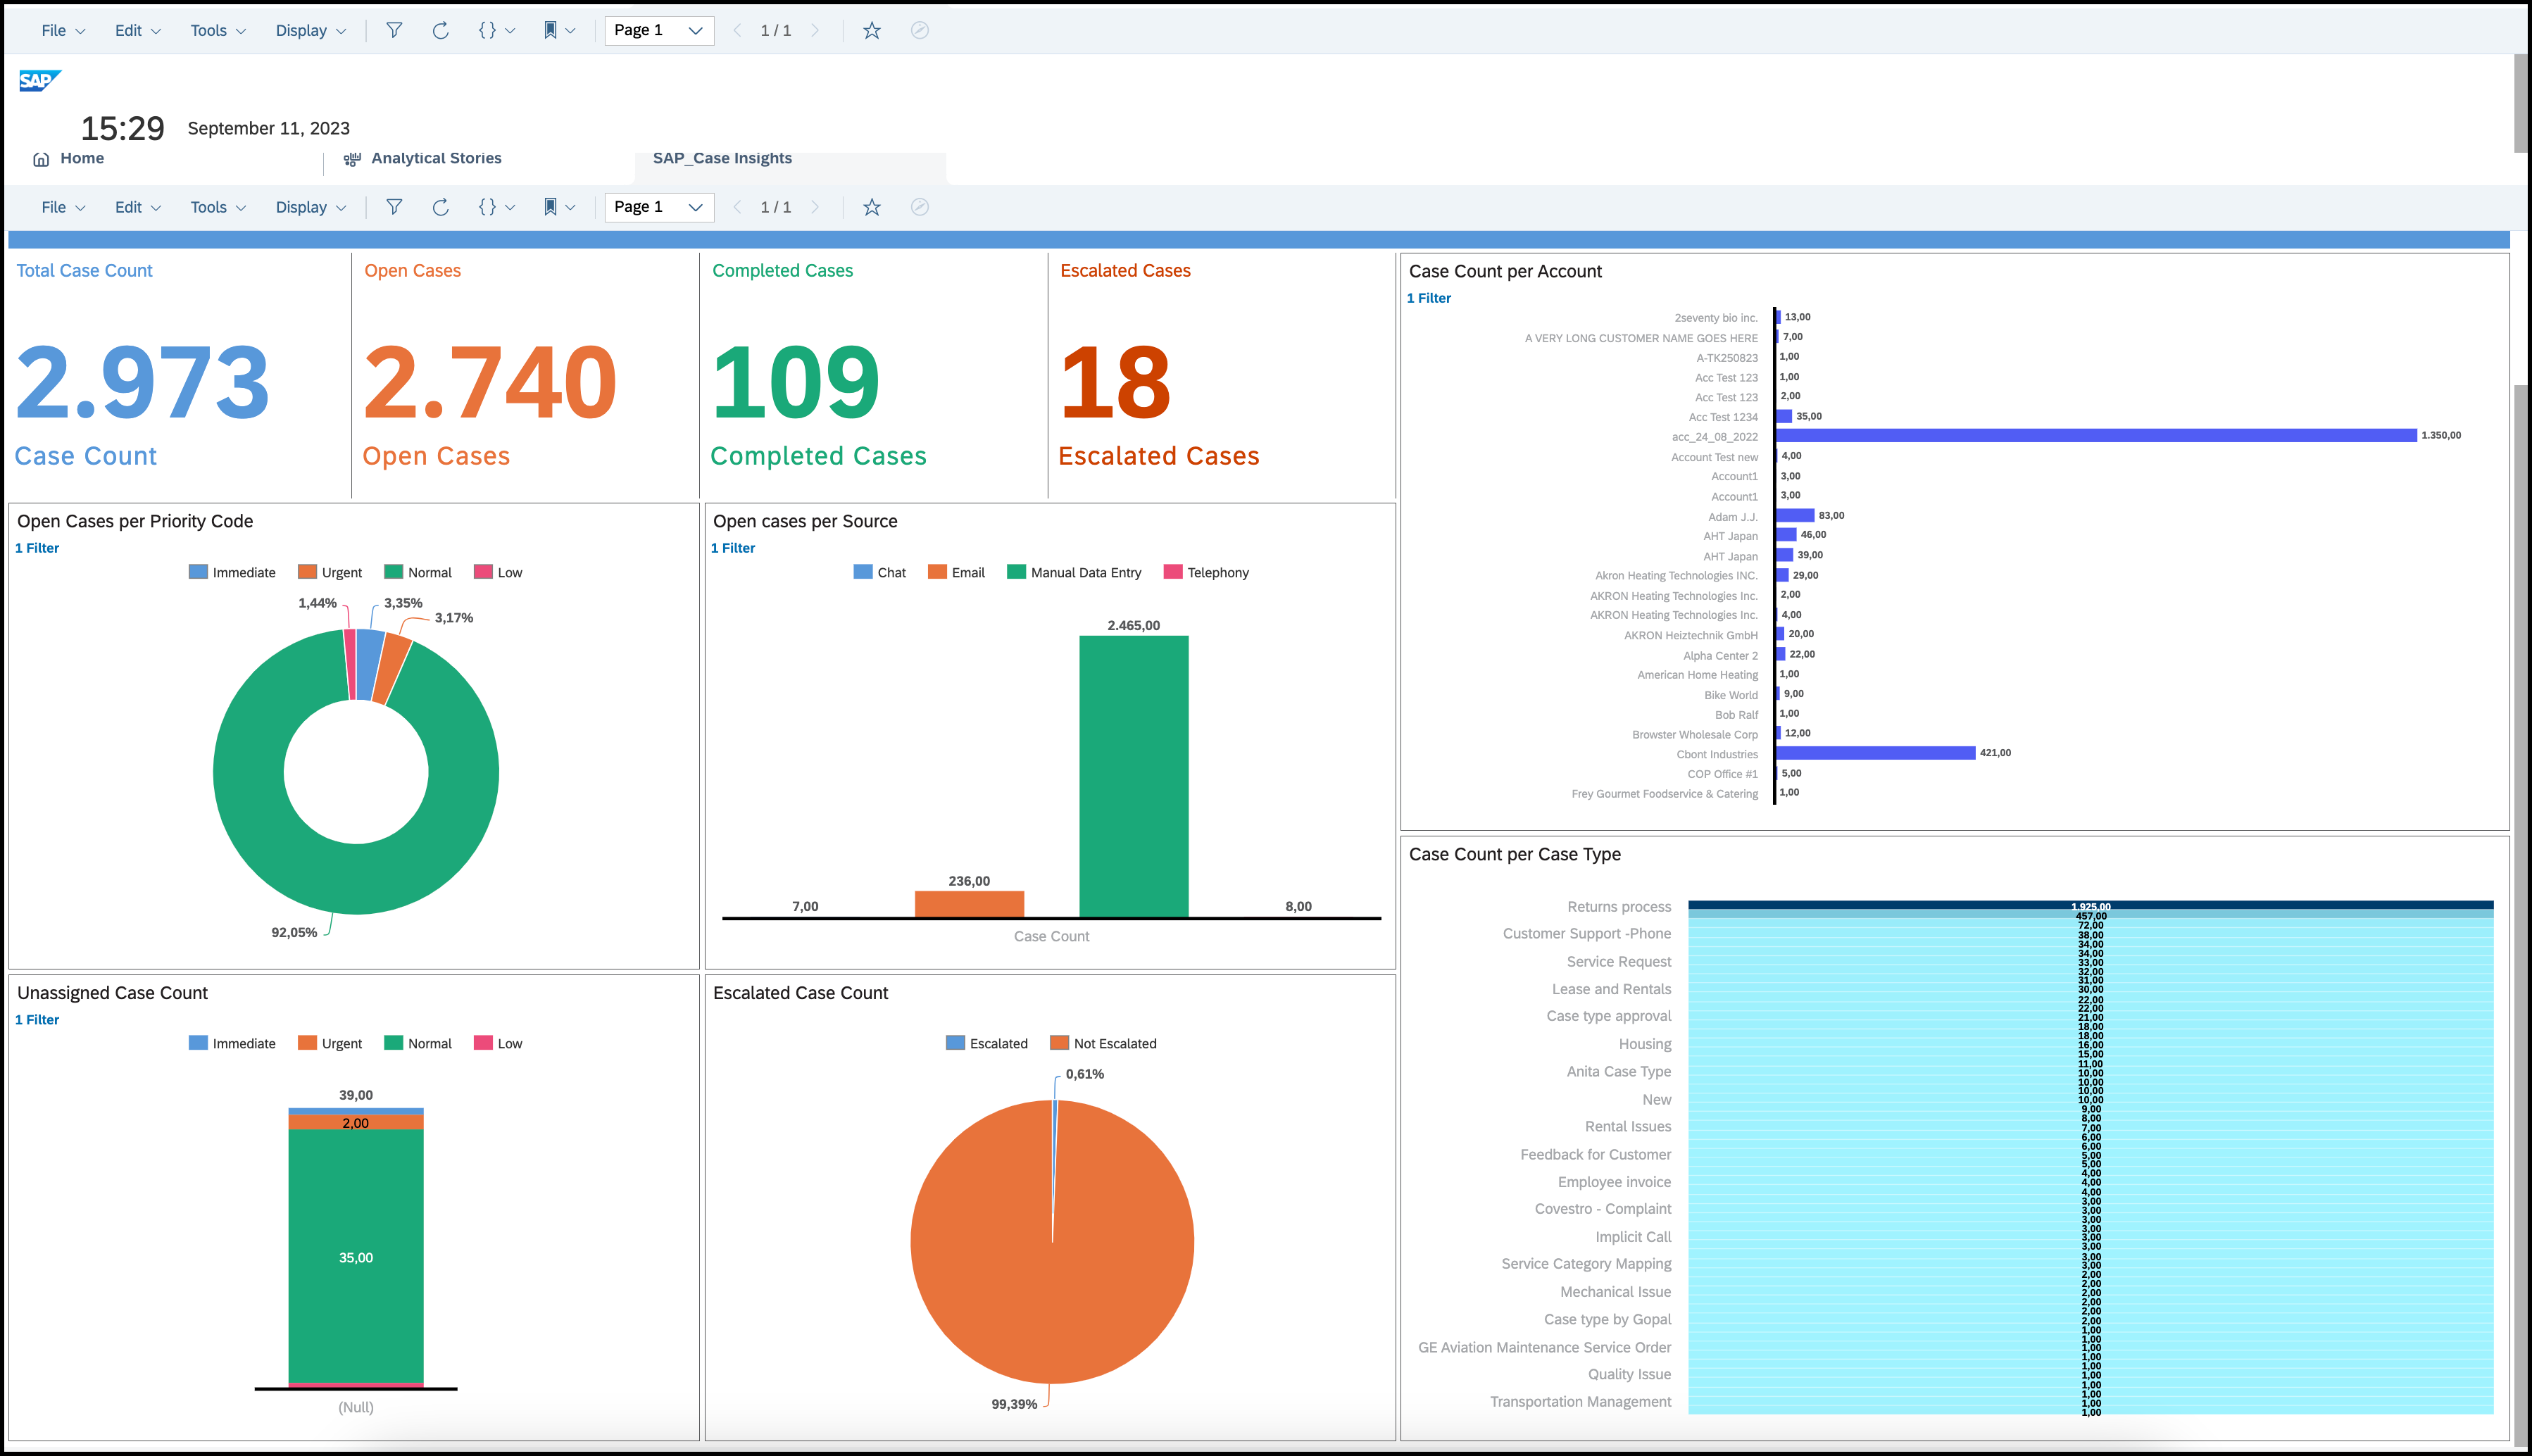
Case Insights
Agents Performance Metrics:
The Agent Performance dashboard is a dedicated tool for closely monitoring agent and team efficiency. It zeroes in on agent workloads, comparing the number of cases they manage with their varying stages and priorities. By understanding this, the dashboard helps ensure tasks are evenly distributed among agents, highlighting both the top-performers and those who might need more support. These insights are invaluable for targeted training and boosting overall team performance, ultimately leading to a higher case completion success rate.

Agents Performance Metrics
Case Escalation Metrics:
The case escalation metrics dashboard is a crucial asset for Service Managers seeking precision in their oversight. It delves meticulously into specific cases or accounts, illuminating pressing customer concerns. By presenting the current open case workload, this dashboard empowers you to prioritize and probe problematic cases based on their type and source. Moreover, it underscores the significance of escalated accounts, sharpening focus on the channels through which such cases emerge. Beyond mere awareness, escalating cases or accounts streamlines communication about pressing issues and ensures a clear path to monitor progress towards their resolution.

Case Escalation Metrics
Service Level Agreement (SLA) Compliance Metrics:
The SLA dashboard offers a deep dive into the efficiency and punctuality of case resolutions against the benchmarks set by Service Level Agreements (SLAs). Central to its design is the timeline feature, which illuminates the sequence of case updates and the key triggers influencing SLA compliance throughout a case's lifecycle. By highlighting critical attributes like 'Initial Review Due On', 'Initial Response Due On', 'Initial Resolution Due On', and 'Completion Due On', the dashboard underscores the importance of timely resolutions. This becomes paramount, as the time taken to address issues directly impacts the overall customer experience, making the SLA dashboard an essential tool for maintaining high service standards.

SLA Compliance Metrics
How Customers Can Harness Our Visualisations
Our dashboards and analytics tools are designed to help customers achieve their business objectives by offering in-depth insights and data-driven guidance. Here’s how you can harness these visualisations to transform your operational strategies and achieve improved results:
Informed Decision Making:
- Sales Cloud: The Pipeline Overview offers a bird's-eye view of your sales landscape. Use it to channel resources effectively and lean on the Sales Performance Overview to ensure your strategies are always backed by real-time data.
- Service Cloud: Leverage the power of Case Insights and Escalation Metrics to understand recurring customer pain points and tailor your approach, ensuring the customer always remains the central focus.
Resource Allocation:
- Sales Cloud: Understand your most lucrative markets and customer segments, allowing you to adjust your marketing campaigns and resources for maximum ROI.
- Service Cloud: Agents Performance Metrics provide a clear picture of workload distribution, ensuring no case goes unnoticed.
Enhancing Customer Experiences:
- Sales Cloud: By decoding the nuances of your sales process, you can provide a frictionless experience for every customer, fostering loyalty and repeat business.
- Service Cloud: Use the SLA Compliance Metrics to maintain and even exceed the standards of resolution times, solidifying your reputation for impeccable customer service.
Skill Development and Training:
- Sales Cloud: Unearth potential weak points in your sales process that could benefit from training or resources, driving continuous team development.
- Service Cloud: Agent Performance Metrics spotlight areas for growth, ensuring every team member receives the support and training they need to excel.
Mitigating Risks Proactively:
- Sales Cloud: Keep a close eye on the Sales Performance Overview to anticipate and counteract potential sales slumps before they impact revenue.
- Service Cloud: Stay on top of potential setbacks with the Case Escalation Metrics, tackling issues head-on before they can escalate.
Future-Proofing Your Strategies:
- Sales Cloud: The Pipeline Overview serves as a predictive tool for revenue projections, facilitating accurate financial planning.
- Service Cloud: Case Insights offers foresight into emerging challenges or growth opportunities, positioning you to adapt and thrive.
Get Started
SAP Sales and Service Cloud offer embedded analytics capabilities that empower users to access, create, and manage stories within SAP Analytics Cloud (SAC). This integration grants all users access to an embedded SAC instance, facilitating data analysis from various sources.
Feature Overview
SAP Analytics Cloud, Embedded Edition, offers the following features within the system:
- Query Designer: This feature is specific to SAC OEM and extends HANA live-type connectivity.
- Linked Analysis: Utilise this feature for drilling down into hierarchical data or creating filters that simultaneously update multiple charts in a story.
- Restricted Measures: These are numerical values with support for mathematical functions, enabling comparisons with a set of values within the same chart or table.
Limitations
Here are some limitations to be aware of regarding analytics in the system:
- Stories can only be built on standard analytical models.
- Story creation is restricted to data sources from SAP Service Cloud Version 2.
- Embedded stories are not available for mobile applications.
- The following features are not supported:
- Embedding tiles on the home page or other system UIs.
- Viewing hierarchical data.
- Reusing models across multiple stories.
- Transporting stories across tenants.
- Individual widget support for embedded tiles.
- Intent-based navigation.
- Lifecycle management scenarios like tenant copy and refresh.
- Story metadata translations.
- Support for extension fields.
- User timezone conversion.
- Calculating date or time differences.
- ID-based sorting in SAC stories.
- Currency and unit conversion.
- Support for different themes.
Getting Started with Out-of-the-Box SAC Stories and Data Models
Follow these steps to begin creating SAC stories and data models:
- Log in to the system and go to the "Design Stories" page.
- Click the "Create Story" button.
- Choose the "Create from Model" option.
- Select the data source from the available list.
- Choose the analytical model from the available options.
- Click the table icon (🠺) to select fields from the data source to include in the model. For a widget displaying the count, select the "Counter" field (recommended over "Count").
- When an analytical model is moved to the query canvas, only related data sources will appear in the "Available Data" section.
- Optionally, click "Preview Query" to view a story preview.
- Click "Finish." In the popup window, provide a name for your new SAC model. The system will open the story designer, where you can add charts and tables.
- Choose "Enable Optimised View" mode and click the save icon (💾). In the popup window, enter a name and description for your new story. The story is now available on the "Design Stories" page.
- To assign or unassign roles for stories, go to the "Design Stories" page, select a story, click the "Assign/Unassign Roles" button, search for a role, select it, and click "Save." Users with assigned business roles can access these stories in the "Analytical Stories" view.
- For editing or deleting stories, select them and use the "Edit" and "Delete" buttons on the "Design Stories" page.
- By following these steps, you can efficiently utilise embedded analytics in SAP Sales and Service Cloud.
Wrapping Up:
Our visualisations are more than just tools; they're gateways to actionable insights. By understanding and leveraging them, you're not just viewing data; you're crafting a roadmap to success. As you navigate these dashboards, remember: every data point is an opportunity, every insight a step forward. Dive in, explore, and let data-driven decisions shape your success story.
- SAP Managed Tags:
- SAP Sales Cloud,
- SAP Service Cloud
Labels:
You must be a registered user to add a comment. If you've already registered, sign in. Otherwise, register and sign in.
Labels in this area
-
Business Trends
270 -
Business Trends
10 -
chitchat
1 -
customerexperience
1 -
Event Information
256 -
Event Information
18 -
Expert Insights
30 -
Expert Insights
49 -
Life at SAP
133 -
Life at SAP
1 -
Product Updates
666 -
Product Updates
25 -
SAP HANA Service
1 -
SAPHANACloud
1 -
SAPHANAService
1 -
Technology Updates
453 -
Technology Updates
15
Related Content
Top kudoed authors
| User | Count |
|---|---|
| 2 | |
| 1 | |
| 1 | |
| 1 | |
| 1 | |
| 1 | |
| 1 | |
| 1 | |
| 1 | |
| 1 |