CRM and CX Blogs by SAP
Stay up-to-date on the latest developments and product news about intelligent customer experience and CRM technologies through blog posts from SAP experts.
cancel
Showing results forย 
Search instead forย 
Did you mean:ย 
former_member240517
Participant
Hello!

I am writing this blog post to show you how to create Dashboards in the Responsive User Interface, also known as Fiori. ๐Ÿ™‚

But... What is a Dashboard?


A dashboard allows you to have a friendly visualization of your business data. It can also store multiple data sources/reports into one.

A consistent and organized dashboard is very important in the decision making process, as it aggregates all the required information and allows you to check trends and making comparisons.

How to create a Dashboard?


In order to create a dashboard, please follow with the steps below:

1. Go to Business Analytics work center and Design Dashboards view;

2. Click on New button;

3. Type a Name;

4. Click on Ok button;

5. In the right panel, under All Reports, select the needed report views;


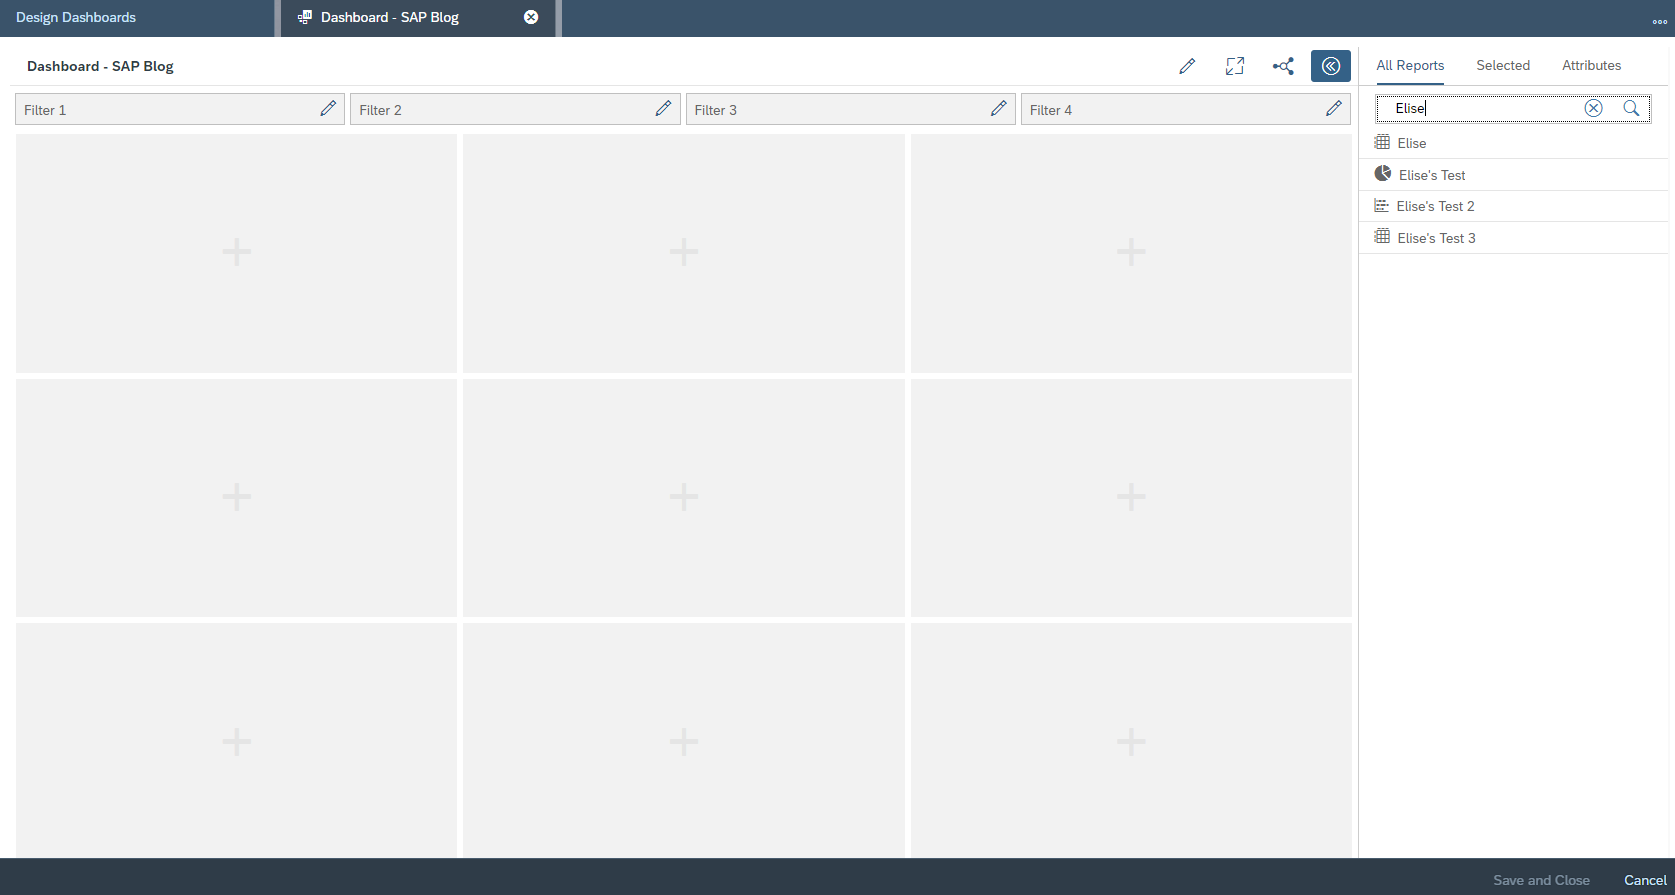
6. Drag and drop the selected reports to the available squares;

7. Select between the available Report Selections for each Report Views;

8. In order to create connections between the Dashboards, click on Define Connections button (connection icon);

9. Select the source dashboard for building the connection;

10. Drag and drop the source dashboard to the target dashboard;

11. In the new screen that has been opened, drag and drop the source field to the Define Connections area;

12. Then drag and drop the target field from the left pane to the Define Connections area;


13. You can also create Global Filters, by dragging and dropping fields from the Attributes tab to the Filter 1, 2, 3 or 4;

14. Click on Save and Close button.

Dashboard Connections


Dashboard connections are interactions between the titles and they can be manually defined by you, as per your business requirements. ๐Ÿ™‚ They are going to work as a filter from a source tile to a target one. ๐Ÿ™‚

Global Filters


This option will allow you to change the selection of the reports within the dashboard at once. With this option you can change the selection of multiple reports within the dashboard at once.


So, do you have any additional doubts about Dashboards? I would be more than happy on figuring it out with you, in case you decide to comment it below. ๐Ÿ˜„


Sincerely,

Elise.
9 Comments
Siraj_Saibudeen
Contributor

Hi Elise,

Thanks for sharing wonderful blogs around the C4C Analytics topics.

I have a question and it might not be related to this blog. We have enabled few home page scorecard tiles, and is there a way to directly navigating to the details view on clicking the scorecard tile. Right now the navigation takes you to the report view with just the counter value.

Example: If there is a scorecard enabled which shows you the number of opportunities assigned to an user. If the user clicks on this scorecard, can the navigation take directly to the details report view which shows all the attributes of an opportunity.

Thanks,

Siraj

former_member240517
Participant
0 Kudos
Hello Siraj,

I hope you are doing well. And thanks for your question, this is genuinely important to me, because with such questions I am able to measure this blog post visibility. ๐Ÿ™‚

Currently, this is not possible, as scorecards are based on reports views, and for creating a scorecard, you need to have a simple report view with only one key figure added to it, without any characteristics (attributes).

I am not sure whether it will be possible to do in the future or not, as scorecards are usually a semi-standard structured report.

However, I think you could make use of KPIs in the home tiles, as they can address much more information than scorecards.

Please let me know about your feedback on this.


Sincerely,

Elise
Siraj_Saibudeen
Contributor

Hi Elise,

Thanks a lot for your quick response.

I did check enabling a KPI without any target or reference value, and added the context report with the detailed view. It really worked and fulfilled our business requirement.

Thanks for sharing your expertise, and keep blogging!! ๐Ÿ™‚

Thanks,

Siraj

former_member240517
Participant
Hi Siraj,

I can't really describe how happy am I for hearing your feedback! Thanks a lot.

Please feel free to address few blog posts ideas, in case you think that I could write about any analytics related topic.


Sincerely,

Elise.
julianoramos
Explorer
Very well documented!


CT-KST
Discoverer
0 Kudos
Hi Elise - I can not create a connection between two reports - I can drag a field from the source but not from the target.

Any Ideas?

Thanks,

Kelie
0 Kudos
Greetings Elise,

Can you please walk me thru on how you came to create these tiles? I am currently working with Dashboard builder and trying to increase my skills.

Thank you,

Tony
RaminS
Participant
0 Kudos
I keep reading this blog and I can't tell if this is for a specific module or not, it just says Fiori, and it doesn't belong to a specific community. At least there's no indication on the page.

Can you please clarify which module or extension we need to build the dashboard you are talking about exists?
bradvukich
Explorer
0 Kudos
Hi Elise, very good description of the Define Connections configuration process.

I have a question about connections. My team and I have this working for graphical reports (bar charts, pie charts, etc.) as the source of the connection. However, our users are requesting a table chart as the source - so a user could click a row in the table and use a parameter of that row as the source key for filtering target reports. Is this possible?

Thanks,
Brad Vukich