- SAP Community
- Products and Technology
- Technology
- Technology Q&A
- how to color a line chart using CSS in SAP Lumira ...
- Subscribe to RSS Feed
- Mark Question as New
- Mark Question as Read
- Bookmark
- Subscribe
- Printer Friendly Page
- Report Inappropriate Content
how to color a line chart using CSS in SAP Lumira Designer 2.1
- Subscribe to RSS Feed
- Mark Question as New
- Mark Question as Read
- Bookmark
- Subscribe
- Printer Friendly Page
- Report Inappropriate Content
on 07-30-2018 8:32 AM
Hi Experts,
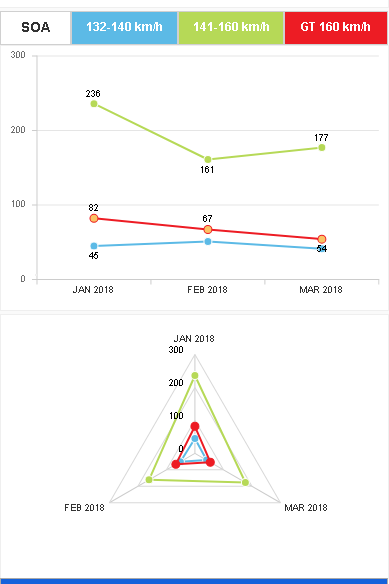
I have a line chart with 3 series. i need to color one of the series Red.
i successfully applied it on Column Chart and Radar Chart. But i am unable to apply in on Line Chart.
i used the following code but it ended up looking like an area chart. filled the entire path.
.custom-line g.v-datapoint-group > g:nth-child(3) path {fill: #ed1c24; stroke: #ed1c24; }
so i removed the fill and used this one.
.custom-line g.v-datapoint-group > g:nth-child(3) path {stroke: #ed1c24; }
now, it colored the line but the circular data points are showing a different color then red ( which is the default color)

Current Tool: SAP Lumira Designer: Release 2.1 SP0 (Version: 21.0.0)
Backend is SAP BW 7.5
- SAP Managed Tags:
- SAP BusinessObjects Design Studio,
- SAP Lumira
Accepted Solutions (0)
Answers (3)
Answers (3)
- Mark as New
- Bookmark
- Subscribe
- Subscribe to RSS Feed
- Report Inappropriate Content
I have a Line chart which includes 12 lines all you need is different colors, what I did was open the Chart > Lines > selected each line by click on it and select colors instead of going to markers , chart background or writing css 😛
You must be a registered user to add a comment. If you've already registered, sign in. Otherwise, register and sign in.
- Mark as New
- Bookmark
- Subscribe
- Subscribe to RSS Feed
- Report Inappropriate Content
Hello Masood,
Can you please tell me the option in Lumira designer 2.1 where in chart properties we can see the css option as we see in design studio 6.1 additional properties tab?
I am trying to use a color palette for a column chart but not getting the option.
Please help.
Regards,
Rafat
You must be a registered user to add a comment. If you've already registered, sign in. Otherwise, register and sign in.
- Mark as New
- Bookmark
- Subscribe
- Subscribe to RSS Feed
- Report Inappropriate Content
.custom-line g.v-datapoint-group > g:nth-child(3) > g.v-datapoint > path {fill: #ed1c24; }
You must be a registered user to add a comment. If you've already registered, sign in. Otherwise, register and sign in.
- SAP Integration Suite - Design Guidelines in the integration flow editor of SAP Cloud Integration in Technology Blogs by SAP
- Essential SAP Fiori Transaction Codes for Fiori Developers in Technology Q&A
- Can we achieve two scrollbars in an SAC table one for dimension and another for measures in freeze in Technology Q&A
- How to Customize SAC UI Themes: A Basic Guide in Technology Blogs by SAP
- Migrate Your Themes with Ease in Technology Blogs by SAP
| User | Count |
|---|---|
| 83 | |
| 9 | |
| 9 | |
| 8 | |
| 7 | |
| 7 | |
| 6 | |
| 5 | |
| 5 | |
| 4 |
You must be a registered user to add a comment. If you've already registered, sign in. Otherwise, register and sign in.