Hello everybody,
I have a big problem with the visible and total horizon of gantt chart.
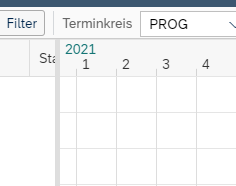
When I open my app the GanttChart is empty and the timeline has following dates:
var oTimeAxis = new sap.gantt.axistime.StepwiseZoomStrategy({
totalHorizon: new sap.gantt.config.TimeHorizon({
startTime: "20200101000000",
endTime: "20241230000000"
}),
visibleHorizon: new sap.gantt.config.TimeHorizon({
startTime: "2021010100000",
endTime: "2022010100000"
}),
When I open a project, the activity are displayed in the ganttchart.
Visible Horizon & Total Horizion has the same dates: start date - 4 month of the earliest activity and the end date + 4 month of the latest activity.
 startdate - 4 month
 enddate + 4 month
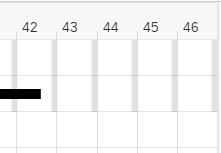
When I add the next project with other activity to the gantt chart. So i get a display problem.
The Visible Horizon & Total Horizon have the correct data by debugging , But it does not display corret in the gantt chart. I used the method setVisibleHorizon() and setTotalHorizon() for setting the data.
 start date ist correct
 end date is not correct.
When I change the size of the gantt chart container, the enddate is also correct now.

 enddate
You must be a registered user to add a comment. If you've already registered, sign in. Otherwise, register and sign in.