- SAP Community
- Products and Technology
- Technology
- Technology Q&A
- BO Web Intelligence date does not diaplay in line ...
- Subscribe to RSS Feed
- Mark Question as New
- Mark Question as Read
- Bookmark
- Subscribe
- Printer Friendly Page
- Report Inappropriate Content
BO Web Intelligence date does not diaplay in line chart
- Subscribe to RSS Feed
- Mark Question as New
- Mark Question as Read
- Bookmark
- Subscribe
- Printer Friendly Page
- Report Inappropriate Content
on 01-31-2019 3:28 PM
We are using SAP BusinessObjects BI Platform 4.2 Support Pack 5.
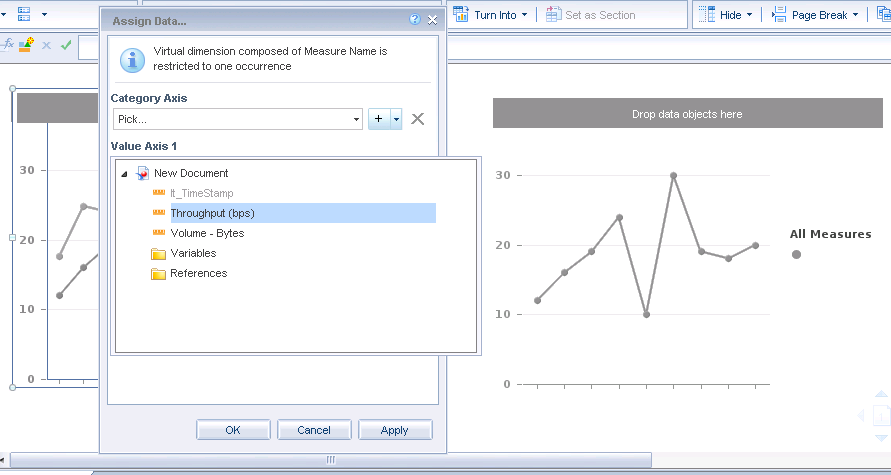
I am new to SAP BO and I am trying to build a line chart with the following data but date does not get display in chart.
We are collecting 5 second performacne data of network interface and tryin gto build a report. timestamp consist date with hh:mm:ss. so there will be 12 samples per minute and some values might be null. lt_TimeStamp is grayed out when I try to select as an object. Any help will be appreciated.

- SAP Managed Tags:
- SAP BusinessObjects - Web Intelligence (WebI)
Accepted Solutions (0)
Answers (2)
Answers (2)
- Mark as New
- Bookmark
- Subscribe
- Subscribe to RSS Feed
- Report Inappropriate Content
Create Dimension variable on "it_TimeStamp" object and try.
You must be a registered user to add a comment. If you've already registered, sign in. Otherwise, register and sign in.
- Mark as New
- Bookmark
- Subscribe
- Subscribe to RSS Feed
- Report Inappropriate Content
Thanks Amit. That worked.
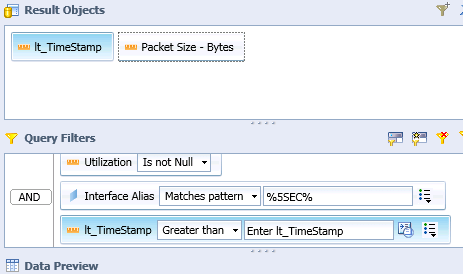
Now, I am trying to plot data for certain date/time period. e.g. last 5 minutes, last 30 minutes, last hour, last day etc.
Since these are not aggregated data, probably I won't be able use out of day functions.
As these data can have 12 samples within a minute (5 sec interval).
How can i generate charts which shows only last five minutes of data?
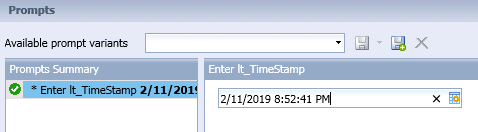
I tried using lt_TimeStamp as a prompt to enter a data/time but it did not work. Looks like format of lt_TimeStamp is different than the prompt value. So the comparison does not work for e.g. lt_Time_stamp greater than <Date prompt>
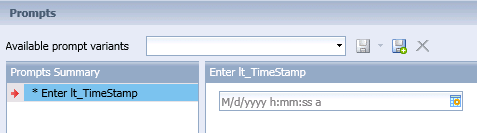
Now that prompt date format (2/11/2019 8:52:41 PM) is different than lt_TimeStamp (2019/02/11 18:10:20) and probably that's the reason it does not work right.
You must be a registered user to add a comment. If you've already registered, sign in. Otherwise, register and sign in.
- plug and gain 101: #3 What is the Process House? in Technology Blogs by SAP
- Artificial Intelligence meets SAP Customer Engagement Initiative - Register until March 08, 2024! in Technology Blogs by SAP
- Card UI Design in a Business Context: A New System for Mobile Apps by SAP in Technology Blogs by SAP
- SAP BI 4.3 SP4: What’s New In Web Intelligence and Semantic Layer in Technology Blogs by SAP
- SAP Signavio Value Accelerators in Action: Reimagine the Way You Transform with Ready to Use Content and Best Practices in Technology Blogs by SAP
| User | Count |
|---|---|
| 75 | |
| 9 | |
| 8 | |
| 7 | |
| 7 | |
| 6 | |
| 6 | |
| 6 | |
| 5 | |
| 4 |
You must be a registered user to add a comment. If you've already registered, sign in. Otherwise, register and sign in.