- SAP Community
- Products and Technology
- Technology
- Technology Q&A
- Negative values in logarithmic axis
Turn on suggestions
Auto-suggest helps you quickly narrow down your search results by suggesting possible matches as you type.
Showing results for
Options
- Subscribe to RSS Feed
- Mark Question as New
- Mark Question as Read
- Bookmark
- Subscribe
- Printer Friendly Page
- Report Inappropriate Content
Negative values in logarithmic axis
former_member58
Explorer
Options
- Subscribe to RSS Feed
- Mark Question as New
- Mark Question as Read
- Bookmark
- Subscribe
- Printer Friendly Page
- Report Inappropriate Content
on 10-14-2018 2:23 PM
i need to view a column chart that her axis is logarithmic with negative values like this:
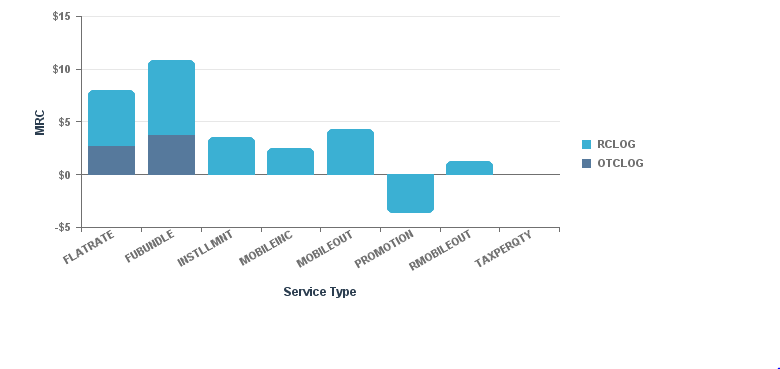
but when I set the axis to be logarithmic i get:

and on liner, the differences are just too big and you can't really see anything
I have created a new variable with this formula
= If([OTC]>0) Then Log10([OTC]) Else -Log10(-[OTC])
and I get close to what I need
but the values are wrong, I need it to be what is written in blue

what can be done?
Accepted Solutions (0)
Answers (1)
Answers (1)
former_member58
Explorer
- Mark as New
- Bookmark
- Subscribe
- Subscribe to RSS Feed
- Report Inappropriate Content
10-22-2018
1:22 PM
someone have a soultion?
You must be a registered user to add a comment. If you've already registered, sign in. Otherwise, register and sign in.
amitrathi239
Active Contributor
- Mark as New
- Bookmark
- Subscribe
- Subscribe to RSS Feed
- Report Inappropriate Content
10-22-2018
1:30 PM
Ask a Question
Related Content
- Single Sign On to SAP Cloud Integration (CPI runtime) from an external Identity Provider in Technology Blogs by SAP
- Linear programming in ABAP. Simplex method. Find optimised BOM in Technology Blogs by Members
- Beginner's Guide to Integration Advisor in Technology Blogs by Members
- AN INTRODUCTION TO QUADRATIC UNCONSTRAINED BINARY OPTIMIZATION (QUBO) in Technology Blogs by SAP
- 5 shades of input parameter types in calculation views in Technology Blogs by Members
Top Q&A Solution Author
| User | Count |
|---|---|
| 93 | |
| 10 | |
| 10 | |
| 9 | |
| 9 | |
| 7 | |
| 6 | |
| 5 | |
| 5 | |
| 4 |
You must be a registered user to add a comment. If you've already registered, sign in. Otherwise, register and sign in.