- SAP Community
- Products and Technology
- Technology
- Technology Q&A
- SAPUI5 - GANTT-Chart - Use OData-Service (XML) to ...
- Subscribe to RSS Feed
- Mark Question as New
- Mark Question as Read
- Bookmark
- Subscribe
- Printer Friendly Page
- Report Inappropriate Content
SAPUI5 - GANTT-Chart - Use OData-Service (XML) to visualize shapes
- Subscribe to RSS Feed
- Mark Question as New
- Mark Question as Read
- Bookmark
- Subscribe
- Printer Friendly Page
- Report Inappropriate Content
on 11-14-2016 8:51 AM
Hello experts,
can anybody help me using the SAPUI5 GANTT-Chart with Table?
https://sapui5.hana.ondemand.com/explored.html#/entity/sap.gantt.GanttChartContainer/samples
The example uses a json file to fill the tree table on the left side. With such a json it is easy to get the shapes on the right gantt-chart visualized.
But in our case we want to use an OData-Service with data from the ERP.
Extraction:

I've build the OData-Service to fill the tree table similiarly to this example: https://blogs.sap.com/2015/10/23/treetable-odata-binding/ --> I've used the annotaion-option to get the hierarchy.
This works to build the tree table hierarchy. But my problem is now, how to visualize the different shapes on every hierarchy-step in the gantt chart.

Code:
[...]
var oGanttChartContainer = this.getView().byId("GanttChartContainer");
var oGanttChartWithTable = oGanttChartContainer.getGanttCharts()[0];
var sPath =  var sServiceUrl = http://##URL##/ZGANTT_ODATA";
var oModel = new sap.ui.model.odata.v2.ODataModel(sServiceUrl, { useBatch : true });
[...]
GanttChartWithTable.bindRows({
   path : '/Auftraege1Set',
   parameters : {
      expand : "ChildNotes",
      numberOfExpandedLevels : 2,
      navigation : {
          'Auftraege1Set' : 'ChildNotes'
      }
}});
[...]
Has anybody experience with this?
How am i able to "connect" the shape correctly to visualize them in the GANTT-Chart?
I did not find an example like this here, maybe anybody could help me to get this done?
Thank you.
Regards
Björn
- SAP Managed Tags:
- SAP Fiori
Accepted Solutions (0)
Answers (5)
Answers (5)
- Mark as New
- Bookmark
- Subscribe
- Subscribe to RSS Feed
- Report Inappropriate Content
Hi,
did somebody find a solution how to bind an oData model to Gantt Chart? I had done the following - the table hierachie works fine but the shapes appear curious:
First I build an oData Service with an entity "TimingAnno". To build the hierachie I have used annoation like in this example https://blogs.sap.com/2015/10/23/treetable-odata-binding/. If I call the service in the browser the structure looks like this:

In the onInit function I created a GanttChartWithTable and bind the oData model on it.
var oGantt = new sap.gantt.GanttChartContainer({ ganttCharts: [ new sap.gantt.GanttChartWithTable({
   columns: [ new sap.ui.table.Column({ label: "Id", template: "Aufgabenid" }),
	      new sap.ui.table.Column({ label: "Bezeichnung", template: "Aufgabenbez" }),
	      new sap.ui.table.Column({ label: "Start", template: new sap.m.DatePicker({ value: {path: "Berstartstring"})}),
	      new sap.ui.table.Column({ label: "Ende", template: new sap.m.DatePicker({ value: {path: "Berendestring"})})
    ]})
]});

var oGanttTable = oGantt.getGanttCharts()[0],
    sServiceUrl = "/sap/opu/odata/sap/Z_PPM_Projekt_SRV/",
    oModel = new sap.ui.model.odata.v2.ODataModel(sServiceUrl);

oGantt.setModel(oModel);
oGanttTable.bindRows({
    path : "/TimingAnnoSet"
});

oGanttTable.setShapeDataNames(["top"]);
oGanttTable.setShapes(this.configShape());
oGantt.placeAt("content");
In the configShape function I did the following but I am not sure what to write at "shapeDataName". If I write nothing in it I get shapes but the appearance is curious.
configShape: function () {
   var aShapes = [];

   Rectangle.extend("sap.gantt.ppm.Rectangle", {
      getFill: function(oRawData) {
         switch (oRawData.level) {
            case "1": return "#FAC364";
            default: return "#5CBAE5";
          }
      }
    });

   var oTopShape = new sap.gantt.config.Shape({
	key: "top",
	shapeDataName: "",
	shapeClassName: "sap.gantt.ppm.Rectangle",
	level: 5,
	shapeProperties: {
		time: "{Berstartstring}",
		endTime: "{Berendestring}",
		height: 20,
		isDuration: true,
		enableDnD: true
	}
   });

   aShapes = [oTopShape];
   return aShapes;
}
And here is the result: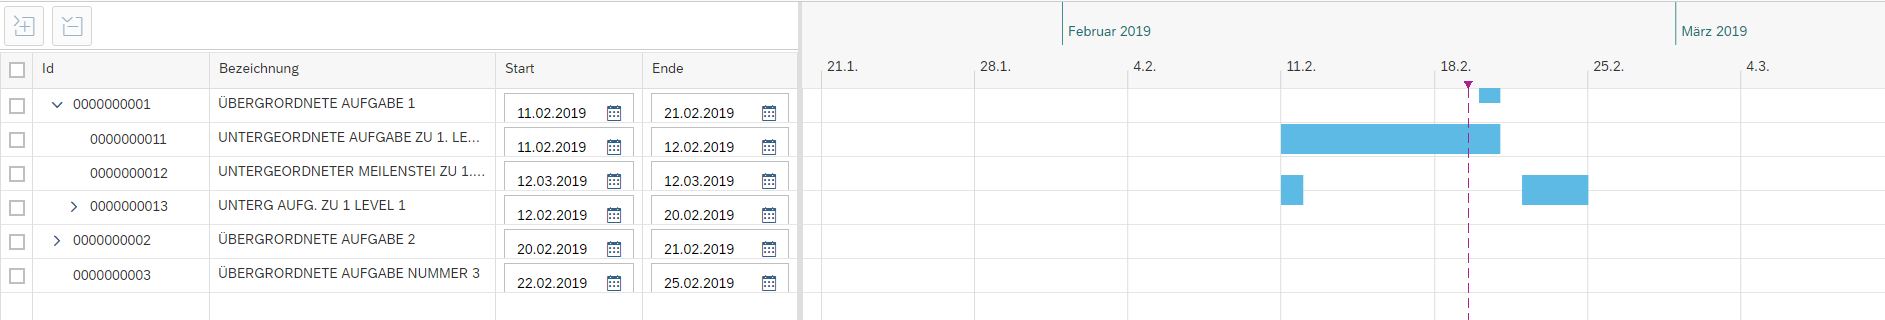
The Tree Table is correct but the shapes in the gantt do not fit to the start and enddate in the related row of the tree table. Can someone help? Which value do I have to write at shapeDataName?
Best regards
Katrin
You must be a registered user to add a comment. If you've already registered, sign in. Otherwise, register and sign in.
- Mark as New
- Bookmark
- Subscribe
- Subscribe to RSS Feed
- Report Inappropriate Content
- Mark as New
- Bookmark
- Subscribe
- Subscribe to RSS Feed
- Report Inappropriate Content
Hello Katrin,
jep, as bjoern.burandt mentioned you Need an unique id, on top Level e.g. the internal Project id, a Network or activity number...
For shapeDataName you Need to provide the Array Name of the datamodel where your orders lay.
if you use oData Model, it's the providing Entity Name.
But your current main Problem is to provide Ids, as we can see on your screenshots, the orders are not laying accurate in the rows. Thats because your Chart's orders have all the same id: "undefined" or "null".
best regards,
stephan
- Mark as New
- Bookmark
- Subscribe
- Subscribe to RSS Feed
- Report Inappropriate Content
- Mark as New
- Bookmark
- Subscribe
- Subscribe to RSS Feed
- Report Inappropriate Content
Hi Steffen,
please provide code snipped of the data binding and shape definition.
- Stephan
You must be a registered user to add a comment. If you've already registered, sign in. Otherwise, register and sign in.
- Mark as New
- Bookmark
- Subscribe
- Subscribe to RSS Feed
- Report Inappropriate Content
Hello,
did someone already figuered out how to use the gantt chart in combination with odata binding? Or is the only way to use it a json model in between of gantt chart and odata?
Many thanks.
You must be a registered user to add a comment. If you've already registered, sign in. Otherwise, register and sign in.
- Mark as New
- Bookmark
- Subscribe
- Subscribe to RSS Feed
- Report Inappropriate Content
Hello Björn,
did you find any solution for your problem? I do have a similar...
You must be a registered user to add a comment. If you've already registered, sign in. Otherwise, register and sign in.
- Mark as New
- Bookmark
- Subscribe
- Subscribe to RSS Feed
- Report Inappropriate Content
If you download the code from same example, you will find the below lines, where the Gantt chart table is set property to get the shapes.
oGanttChartWithTable.setShapeDataNames(["top", "order", "relationship"]);
oGanttChartWithTable.setShapes(this._configShape());
Downloaded example works perfectly for me.
You must be a registered user to add a comment. If you've already registered, sign in. Otherwise, register and sign in.
| User | Count |
|---|---|
| 101 | |
| 13 | |
| 13 | |
| 11 | |
| 11 | |
| 7 | |
| 6 | |
| 5 | |
| 4 | |
| 4 |
You must be a registered user to add a comment. If you've already registered, sign in. Otherwise, register and sign in.