- SAP Community
- Products and Technology
- Technology
- Technology Q&A
- Need help for Column Chart css to change the color...
- Subscribe to RSS Feed
- Mark Question as New
- Mark Question as Read
- Bookmark
- Subscribe
- Printer Friendly Page
- Report Inappropriate Content
Need help for Column Chart css to change the colors of the columns in Lumira Designer 2.0 SP1
- Subscribe to RSS Feed
- Mark Question as New
- Mark Question as Read
- Bookmark
- Subscribe
- Printer Friendly Page
- Report Inappropriate Content
on 06-16-2018 4:05 PM
Hello All,
I am using a Lumira designer 2.0 SP1 and chart type is Column Chart. I have two columns in the chart for Measure 1 and Measure 2. I would like to change the colors of the columns individually. right now I have a code provided by one of our valuable member and it is working for me as a group of columns.
.customChart1 g.v-m-main g.v-m-plot g.v-plot-main g.v-datapoint-group .v-datapoint rect{fill: #808080}
Even I wrote few other codes mentioned in other blogs which are not working.Here is the code which is not working
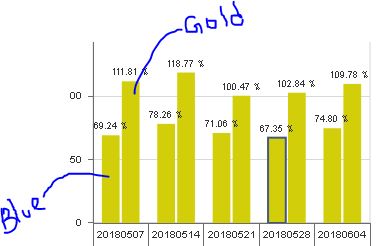
.customChart1 g.v-column g.v-datashape:nth-child(1) rect.v-datapoint.v-morphable-datapoint {fill: yellow !important;}
.customChart1 g.v-column g.v-datashape:nth-child(2) rect.v-datapoint.v-morphable-datapoint {fill: blue;}
.customChart1 g.v-legend-content g.v-row.ID_0 path {fill: yellow;}
.customChart1 g.v-legend-content g.v-row.ID_1 path {fill: blue;}
It would be helpful if I get a list of css classes for all the charts or as well as other components and also I would like to know how to identify a class for a component.
- SAP Managed Tags:
- SAP BusinessObjects Design Studio
Accepted Solutions (1)
Accepted Solutions (1)
- Mark as New
- Bookmark
- Subscribe
- Subscribe to RSS Feed
- Report Inappropriate Content
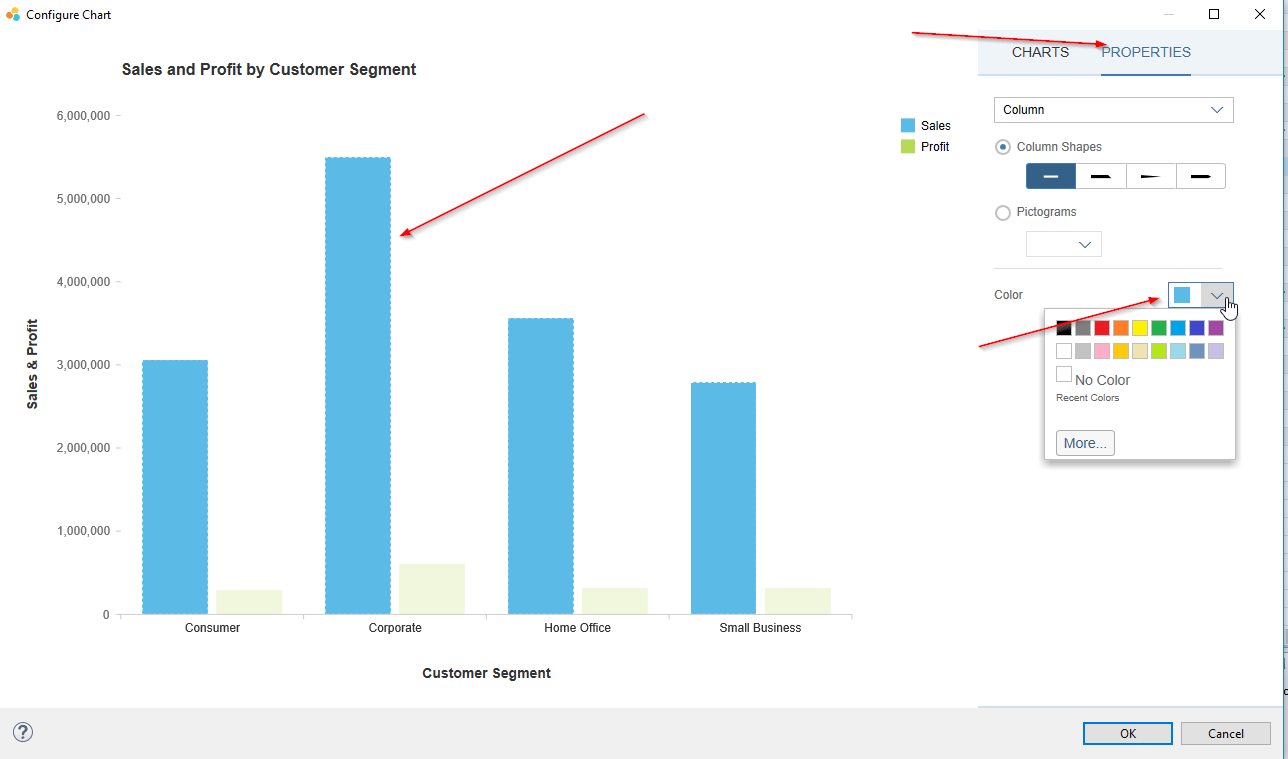
HI in Lumira Designer 2.0 and onwards you can configure the colors when configuring the chart
1) In properties choose chart configuring
2) click on properties and the click on the column you need to change the color of
 Or you can use the conditional formatting component to define the color for the chart
either on a dimension or an measure
http://visualbi.com/blogs/sap-lumira-designer/conditional-formatting-sap-lumira-designer/
for key figures (measures) choose for all values instead of selecting a larger or smaller than - then it will always keep the color you define. I find this solution more persistent when changing dimension and measures in the chart via a script
Br
René
You must be a registered user to add a comment. If you've already registered, sign in. Otherwise, register and sign in.
- Mark as New
- Bookmark
- Subscribe
- Subscribe to RSS Feed
- Report Inappropriate Content
Answers (2)
Answers (2)
- Mark as New
- Bookmark
- Subscribe
- Subscribe to RSS Feed
- Report Inappropriate Content
if there is no data initially in development, how can we change the color ?
You must be a registered user to add a comment. If you've already registered, sign in. Otherwise, register and sign in.
- Mark as New
- Bookmark
- Subscribe
- Subscribe to RSS Feed
- Report Inappropriate Content
Hello Rene,
Thanks for addressing my issue.
First part about using chart properties was known to me and I did that. But the conditional formatting was new to me. I will try that and let you know.
Apart from that, here I wanted to know the css script for the chart and use it instead of properties. Out of curiosity I am trying to find all the css classes for chart by right click on the dashboard - select inspect element. I found many classes but unable to use them. tried a lot of combinations to achieve this using css, but nothing is working for me. I would like to know what is the hierarchy like below.
.customChart1 g.v-m-main g.v-m-plot g.v-plot-main g.v-datapoint-group .v-datapoint rect{fill: #808080}
Please need help on understanding this better.
You must be a registered user to add a comment. If you've already registered, sign in. Otherwise, register and sign in.
- Mark as New
- Bookmark
- Subscribe
- Subscribe to RSS Feed
- Report Inappropriate Content
Hi I just tried to create a CSS for a column chart
.Chart g.v-m-main g.v-m-plot g.v-plot-main g.v-datapoint-group .v-datapoint:nth-child(2) rect
{ fill: #ECECED!important;}
.Chart g.v-m-main g.v-m-plot g.v-plot-main g.v-datapoint-group .v-datapoint:nth-child(3) rect
{ fill: #B9BABB!important;}
the nth.child(x) starts at 2 (that is the first column) do not know why it starts at 2 -- but is does, it might be different in your application - so a bit of bungy jumping amongst the numbers might be necessary

- Mark as New
- Bookmark
- Subscribe
- Subscribe to RSS Feed
- Report Inappropriate Content
- Sneak Peek in to SAP Analytics Cloud release for Q2 2024 in Technology Blogs by SAP
- Display of TOP 5 in SAP Lumira in Technology Q&A
- How to get "full control" on columns design in a SAP Analytics cloud table ? in Technology Q&A
- What’s New in SAP Datasphere Version 2024.4 — Feb 13, 2024 in Technology Blogs by Members
- How to easily perform live ad-hoc analysis on SAP BW Queries in SAP Analytics Cloud in Technology Blogs by SAP
| User | Count |
|---|---|
| 98 | |
| 11 | |
| 11 | |
| 10 | |
| 10 | |
| 8 | |
| 6 | |
| 5 | |
| 4 | |
| 4 |
You must be a registered user to add a comment. If you've already registered, sign in. Otherwise, register and sign in.