- SAP Community
- Products and Technology
- Technology
- Technology Q&A
- Webi: No text on diagrams
- Subscribe to RSS Feed
- Mark Question as New
- Mark Question as Read
- Bookmark
- Subscribe
- Printer Friendly Page
- Report Inappropriate Content
Webi: No text on diagrams
- Subscribe to RSS Feed
- Mark Question as New
- Mark Question as Read
- Bookmark
- Subscribe
- Printer Friendly Page
- Report Inappropriate Content
on 02-15-2018 9:18 AM
Hello,
When creating a report, and adding a chart for example:

It works great but as soon as I convert it into a diagram I have no text, no legend, no nothing that is displayed apart from the diagram in itself:

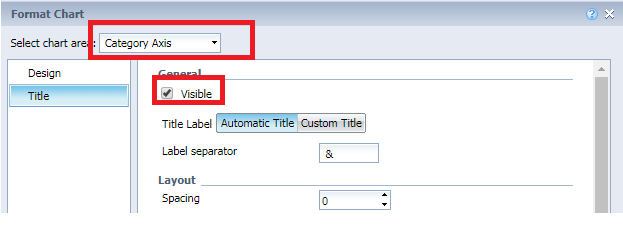
We can see with the mouse that the boxes are created for the title for example, but noting is displayed. The "Visible" checkboxes are marked so it is not that.
What could it be? I tried to change the background color if it was written white on white but it isn't 🙂
Thanks!
Accepted Solutions (1)
Accepted Solutions (1)
- Mark as New
- Bookmark
- Subscribe
- Subscribe to RSS Feed
- Report Inappropriate Content
It seems both are the measure objects and assigned to value axis.There is no object assigned at catergory axis.
Right click on chart->Assign data-> check if any object/variable assigned to Catergory axis.
You must be a registered user to add a comment. If you've already registered, sign in. Otherwise, register and sign in.
- Mark as New
- Bookmark
- Subscribe
- Subscribe to RSS Feed
- Report Inappropriate Content

- Mark as New
- Bookmark
- Subscribe
- Subscribe to RSS Feed
- Report Inappropriate Content
- Mark as New
- Bookmark
- Subscribe
- Subscribe to RSS Feed
- Report Inappropriate Content
- Mark as New
- Bookmark
- Subscribe
- Subscribe to RSS Feed
- Report Inappropriate Content
- Mark as New
- Bookmark
- Subscribe
- Subscribe to RSS Feed
- Report Inappropriate Content
It doesn't work either.
I've just tried by using the desktop app on Windows and it displays correctly there!
So I've went with re-enabling HTML and trying different browsers but it does not work on latest versions of Edge, Chrome nor Firefox.
Do you know what could be wrong with this new information?
- Mark as New
- Bookmark
- Subscribe
- Subscribe to RSS Feed
- Report Inappropriate Content
- Mark as New
- Bookmark
- Subscribe
- Subscribe to RSS Feed
- Report Inappropriate Content
- Mark as New
- Bookmark
- Subscribe
- Subscribe to RSS Feed
- Report Inappropriate Content
I would suggest to open the ticket with SAP support team and they will investiagte.
- Mark as New
- Bookmark
- Subscribe
- Subscribe to RSS Feed
- Report Inappropriate Content
Thanks, will do!
Answers (0)
- How to properly merge N:N Dimensions from 2 queries from different Universes? in Technology Q&A
- SAP BTP Innobytes – March 2024 in Technology Blogs by SAP
- how to create a text input control based on partial text or number for filtering a report in Technology Q&A
- A function in Webi which gives the position of specific caharacter's occurrence multiple times in Technology Q&A
- Consume the SAP Cloud ALM Custom Processes API in Technology Blogs by SAP
| User | Count |
|---|---|
| 93 | |
| 10 | |
| 10 | |
| 9 | |
| 9 | |
| 7 | |
| 6 | |
| 5 | |
| 5 | |
| 4 |
You must be a registered user to add a comment. If you've already registered, sign in. Otherwise, register and sign in.