- SAP Community
- Groups
- Interest Groups
- Application Development
- Discussions
- What are the performance tools in ABAP ?
- Subscribe to RSS Feed
- Mark Topic as New
- Mark Topic as Read
- Float this Topic for Current User
- Bookmark
- Subscribe
- Mute
- Printer Friendly Page
What are the performance tools in ABAP ?
- Mark as New
- Bookmark
- Subscribe
- Mute
- Subscribe to RSS Feed
- Permalink
- Report Inappropriate Content
05-13-2008 2:45 PM
What are the performance tools in ABAP ?
some thing like SQL Trace, Runtime Analysis ......what else ?
- SAP Managed Tags:
- ABAP Development,
- ABAP Testing and Analysis
- Mark as New
- Bookmark
- Subscribe
- Mute
- Subscribe to RSS Feed
- Permalink
- Report Inappropriate Content
05-13-2008 2:49 PM
- Mark as New
- Bookmark
- Subscribe
- Mute
- Subscribe to RSS Feed
- Permalink
- Report Inappropriate Content
05-13-2008 2:50 PM
Hi,
1) SCI Code Inspector
2) ST05 Performance Trace
3) SE30 Runtime Analysis
4) ST03G Global Statistical Records
STAD Statistical Records
5) ST30 Global Performance Analysis
Reward if useful
Thanks,
Swamy Kunche
- SAP Managed Tags:
- ABAP Development,
- ABAP Testing and Analysis
- Mark as New
- Bookmark
- Subscribe
- Mute
- Subscribe to RSS Feed
- Permalink
- Report Inappropriate Content
05-13-2008 2:53 PM
Where can i get the documentation on them ?
- SAP Managed Tags:
- ABAP Development,
- ABAP Testing and Analysis
- Mark as New
- Bookmark
- Subscribe
- Mute
- Subscribe to RSS Feed
- Permalink
- Report Inappropriate Content
05-13-2008 2:50 PM
hi,
Runtime Monitor
http://help.sap.com/saphelp_47x200/helpdata/en/b5/fa121cc15911d5993d00508b6b8b11/content.htm
Memory Inspector
http://help.sap.com/saphelp_47x200/helpdata/en/a2/e5fc84cc87964cb2c29f584152d74e/content.htm
Run Time Analyser
http://help.sap.com/saphelp_47x200/helpdata/en/c6/617cafe68c11d2b2ab080009b43351/content.htm
SQL trace
http://help.sap.com/saphelp_47x200/helpdata/en/d1/801f7c454211d189710000e8322d00/content.htm
- SAP Managed Tags:
- ABAP Development,
- ABAP Testing and Analysis
- Mark as New
- Bookmark
- Subscribe
- Mute
- Subscribe to RSS Feed
- Permalink
- Report Inappropriate Content
07-15-2008 4:51 AM
- Mark as New
- Bookmark
- Subscribe
- Mute
- Subscribe to RSS Feed
- Permalink
- Report Inappropriate Content
05-06-2020 4:25 PM
Hi, it might be that this update comes a little bit late, but I hope it is helpful.
We recently released a new tool "profile data analyzer" which is a standalone tool to systematically analyze and visualize profiling data files (ABAP: SE30/SAT, Java: profiling files from SAP JVM Profiler), and it could create graphical analysis reports and interactive flame graphs for ABAP performance trace.
The following blog posts contain an introduction to the profile data analyzer.
- https://blogs.sap.com/2020/04/01/analyze-abap-performance-traces-with-the-profile-data-analyzer/
- https://blogs.sap.com/2020/05/06/understanding-the-abap-program-logic-with-profile-data-analyzer-for...
More resources for the profile data analyzer can be found on the following wiki page.
- https://wiki.scn.sap.com/wiki/x/9g_CI
- https://wiki.scn.sap.com/wiki/display/CPP/Profile+Data+Analyzer+-+A+Tool+to+Analyze+the+Performance+...
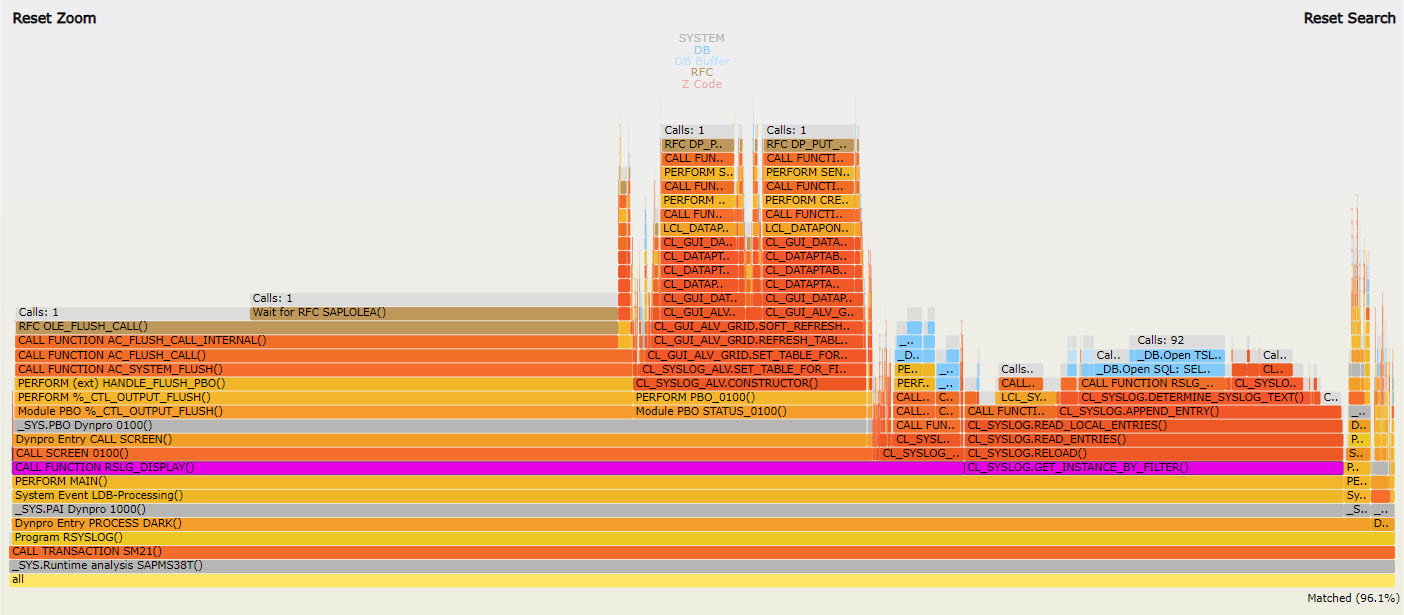
At last, here is an example flame graph and the tips about how to get information from this flame graph.
- Every column is a call stack. The main program is at the bottom.
- The lower method calls the upper method.
- The width in the graph is proportional to the actual time used by that call stack.
- We could zoom in or zoom out in the graphic view by clicking a method on the call stack.
- Click the "Search" button to search with regular expressions.
- The search results will be highlighted in purple.
- Move the mouse to a method, the tooltip will show more detailed time information.
- Special method types have dedicated colors. For example, DB methods are blue.
- The call count of a call stack is shown like "Calls: XXX" on top of the call stack.
Best regards,
Qiansheng
- SAP Managed Tags:
- ABAP Development,
- ABAP Testing and Analysis
- Mark as New
- Bookmark
- Subscribe
- Mute
- Subscribe to RSS Feed
- Permalink
- Report Inappropriate Content
05-07-2020 8:47 AM
You should do this as a blog. Not as an answer to a question,
- SAP Managed Tags:
- ABAP Development,
- ABAP Testing and Analysis
- Mark as New
- Bookmark
- Subscribe
- Mute
- Subscribe to RSS Feed
- Permalink
- Report Inappropriate Content
05-13-2020 6:31 PM
Let me add that with software component ST-A/PI you get transaction ST12, that provides
- collection of ABAP, SQL trace summary, stad records into database table -- you can access instance-independently and unlike ST05 trace, there is no risk of trace being overwritten after collection at least.
Take care, it by default deletes the SAT trace files to free up file system space, that can be turned off - additional analysis features especially for ABAP traces, bottom-up and top-down call hierarchy display etc. even on aggregated traces
- SAP Managed Tags:
- ABAP Development,
- ABAP Testing and Analysis