- SAP Community
- Products and Technology
- Technology
- Technology Q&A
- Design Studio Infochart column css
- Subscribe to RSS Feed
- Mark Question as New
- Mark Question as Read
- Bookmark
- Subscribe
- Printer Friendly Page
- Report Inappropriate Content
Design Studio Infochart column css
- Subscribe to RSS Feed
- Mark Question as New
- Mark Question as Read
- Bookmark
- Subscribe
- Printer Friendly Page
- Report Inappropriate Content
on 12-20-2017 11:47 AM
Hi,
I have a Design Studio Infochart with 2 Key Figure column groups. I am trying to change colour of 1st group to blue and second to red with CSS. However one column (the one with value 740) is coloured with red.

In the CSS file I put some CSS:
.chartColumn1 g.v-m-main g.v-m-plot g.v-plot-main g.v-datapoint-group g:nth-of-type(1) rect  {
   fill: blue;
} .chartColumn1 g.v-m-main g.v-m-plot g.v-plot-main g.v-datapoint-group g:nth-of-type(2) rect  {
   fill: red;
}
As you can see from attached CSS extract for Infochart object key figure objects are coming in <g> groups.
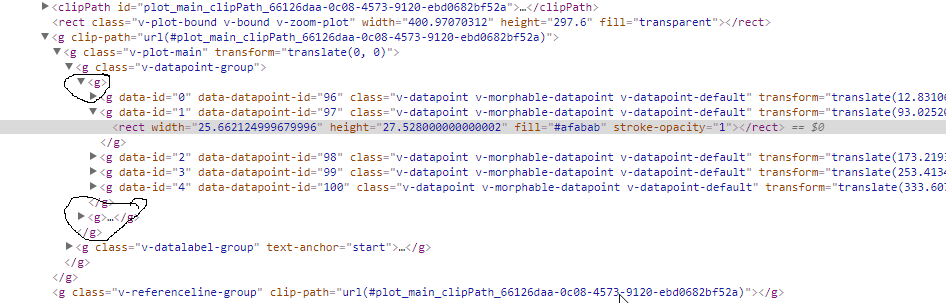
The idea is that CSS should colour first group objects with blue color and second one should be red. It seems to work this way however one rect element seems to be red.
Do you guys have any idea what could be the issue here?
Thanks.
- SAP Managed Tags:
- HTML5,
- SAP BusinessObjects Design Studio,
- SAP Lumira
Accepted Solutions (1)
Accepted Solutions (1)
- Mark as New
- Bookmark
- Subscribe
- Subscribe to RSS Feed
- Report Inappropriate Content
You can use following css:
.myChart .v-datapoint-group>g:nth-child(1)>g>rect{
    fill: blue;
}

.myChart .v-datapoint-group>g:nth-child(2)>g>rect{
    fill: red;
}
But again same question: why css when you can define the colors in the property sheet in an easier way? Do you want to change the colors dynamically in script ?
You must be a registered user to add a comment. If you've already registered, sign in. Otherwise, register and sign in.
- Mark as New
- Bookmark
- Subscribe
- Subscribe to RSS Feed
- Report Inappropriate Content
Answers (1)
Answers (1)
- Mark as New
- Bookmark
- Subscribe
- Subscribe to RSS Feed
- Report Inappropriate Content

You must be a registered user to add a comment. If you've already registered, sign in. Otherwise, register and sign in.
- Mark as New
- Bookmark
- Subscribe
- Subscribe to RSS Feed
- Report Inappropriate Content
- What’s New in SAP HANA Cloud – March 2024 in Technology Blogs by SAP
- Calculation View Features of 2024 QRC1 in Technology Blogs by SAP
- Instruction of implement-test-deploy flow for SAPUI5 plus CAP integrated with another services in Technology Blogs by Members
- Sap Hana Online Table Partitioning - Example in Technology Q&A
- Can I extend a certain app? With Clean Core? How? in Technology Blogs by SAP
| User | Count |
|---|---|
| 101 | |
| 13 | |
| 13 | |
| 11 | |
| 11 | |
| 7 | |
| 6 | |
| 5 | |
| 4 | |
| 4 |
You must be a registered user to add a comment. If you've already registered, sign in. Otherwise, register and sign in.