- SAP Community
- Products and Technology
- Technology
- Technology Q&A
- How do I set totals in a Designer 2.0 waterfall gr...
- Subscribe to RSS Feed
- Mark Question as New
- Mark Question as Read
- Bookmark
- Subscribe
- Printer Friendly Page
- Report Inappropriate Content
How do I set totals in a Designer 2.0 waterfall graph?
- Subscribe to RSS Feed
- Mark Question as New
- Mark Question as Read
- Bookmark
- Subscribe
- Printer Friendly Page
- Report Inappropriate Content
on 11-09-2017 4:08 PM
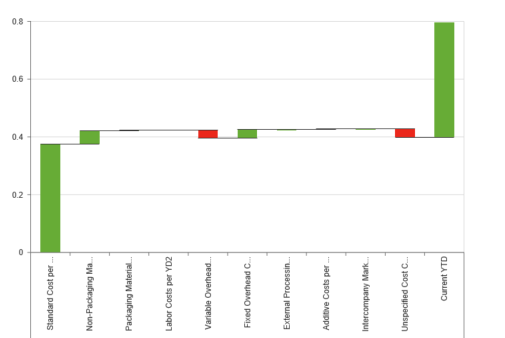
I have created a BW query that yields the following result.
Previous YTD 0.375
Non-Packaging Material Costs per YD2 0.047
Packaging Material Costs per YD2 0
Labor Costs per YD2 0.001
Variable Overhead Costs per YD2 -0.027
Fixed Overhead Costs per YD2 0.029
External Processing per YD2 0
Additive Costs per YD2 0.002
Intercompany Markup per YD2 0
Unspecified Cost Comp per YD2 -0.029
Current YTD0.398
I have created a Designer application, added the data set, and I'm attempting to configure a waterfall graph. As long as I use a managed OLAP connection, I'm able to choose the waterfall chart type. I initially get what I expect.
I go to chart configuration and try to set my two total columns by right-clicking one of the columns that should be a total.

The software renders the following.

I'm trying to get the following.

Thank you for your help.
- SAP Managed Tags:
- SAP BusinessObjects Design Studio,
- SAP Lumira
Accepted Solutions (0)
Answers (2)
Answers (2)
- Mark as New
- Bookmark
- Subscribe
- Subscribe to RSS Feed
- Report Inappropriate Content
Hi Mark,
I have the same problem. It seems to me, that it is not possible with a static query structure. It looks like it works, if your waterfall bars are not defined by a query structure but by adding a drill down for a certain InfoObject and the same key figure. However this does not solve my problem. This used to work with DS 1.6 (not in m-mode). Hope this gets fixed soon.
Best regards
Dominik
You must be a registered user to add a comment. If you've already registered, sign in. Otherwise, register and sign in.
- Mark as New
- Bookmark
- Subscribe
- Subscribe to RSS Feed
- Report Inappropriate Content
Hi Dominik, Hi Mark,
I do have exactly the problem that you are describing.
Although using the latest Lumira Designer Release & Support Package.
Did you find any other solution for this issue?
Kind regards,
Klaus
You must be a registered user to add a comment. If you've already registered, sign in. Otherwise, register and sign in.
- What’s New in SAP Analytics Cloud Release 2024.07 in Technology Blogs by SAP
- How to easily perform live ad-hoc analysis on SAP BW Queries in SAP Analytics Cloud in Technology Blogs by SAP
- What’s New in SAP Analytics Cloud Q1 2024 in Technology Blogs by SAP
- What’s New in SAP Analytics Cloud Release 2024.01 in Technology Blogs by SAP
- What’s New in SAP Analytics Cloud Release 2023.24 in Technology Blogs by SAP
| User | Count |
|---|---|
| 86 | |
| 10 | |
| 10 | |
| 9 | |
| 6 | |
| 6 | |
| 6 | |
| 5 | |
| 4 | |
| 3 |
You must be a registered user to add a comment. If you've already registered, sign in. Otherwise, register and sign in.