- SAP Community
- Products and Technology
- Technology
- Technology Q&A
- The Best Run Juice Company Sample Design
- Subscribe to RSS Feed
- Mark Question as New
- Mark Question as Read
- Bookmark
- Subscribe
- Printer Friendly Page
- Report Inappropriate Content
The Best Run Juice Company Sample Design
- Subscribe to RSS Feed
- Mark Question as New
- Mark Question as Read
- Bookmark
- Subscribe
- Printer Friendly Page
- Report Inappropriate Content
on 10-27-2017 5:20 PM
Dear Specialists,
I am new in SAP Cloud Analytics. At the moment the moment I am working with the Trial version. Great tool, and I am 100 % sure that my company will buy it.
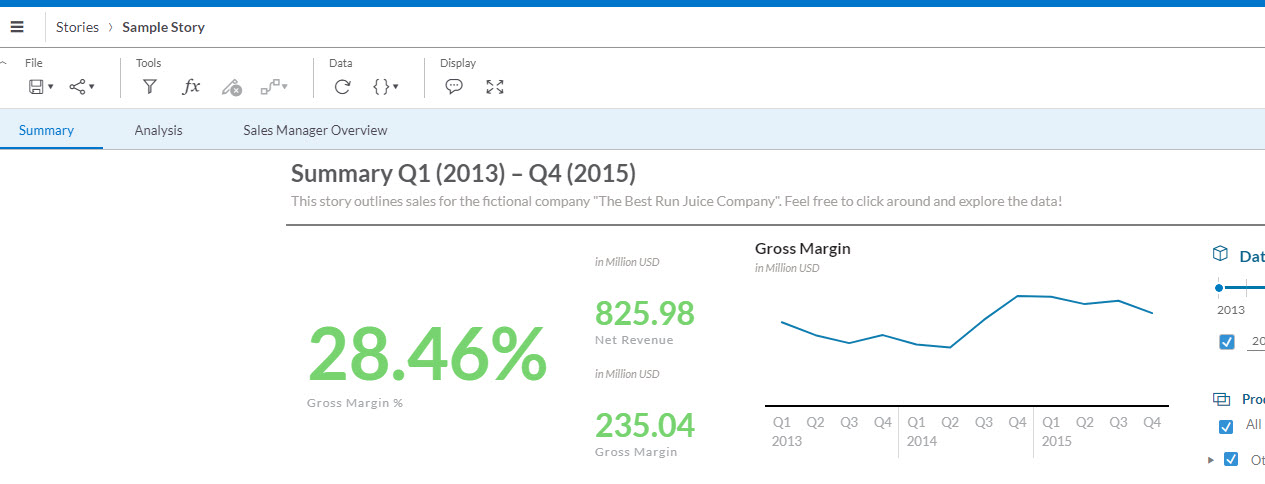
There is a Sample (Revenue Analysis). I want to have a look into the Design of this Sample. But I could not find a way.
Is there a possibilty to have a deeper look int the Design?
Thank you for feedback
Sigi Weber
- SAP Managed Tags:
- SAP Analytics Cloud
Accepted Solutions (1)
Accepted Solutions (1)
- Mark as New
- Bookmark
- Subscribe
- Subscribe to RSS Feed
- Report Inappropriate Content
Hi Sigi,
When opened the story, it will be in "View" mode.
All you need to do is to switch to designer mode (by clicking on "Edit" on right upper corner), click to the right tab to the "Builder" and have a particular chart highlighted.
If the above buttons are non visible for you, please save the story for yourself first (by Save as.. > into path: My files) then try edit/explore the charts in there to see how SAP has created those.
Please let me know how this does help. Best Regards, Mark
You must be a registered user to add a comment. If you've already registered, sign in. Otherwise, register and sign in.
Answers (2)
Answers (2)
- Mark as New
- Bookmark
- Subscribe
- Subscribe to RSS Feed
- Report Inappropriate Content
Hi siegfried.weber5 ,
I am not sure if this is what you need but you might take a look at our Guided Learning videos here.
It helps you how to play around or discover more within SAP Analytics Cloud.
Additionally to that I'm pretty sure you'll find more helpful blogs and content there.
Cheers,
Mark
You must be a registered user to add a comment. If you've already registered, sign in. Otherwise, register and sign in.
- Mark as New
- Bookmark
- Subscribe
- Subscribe to RSS Feed
- Report Inappropriate Content
- Mark as New
- Bookmark
- Subscribe
- Subscribe to RSS Feed
- Report Inappropriate Content

You must be a registered user to add a comment. If you've already registered, sign in. Otherwise, register and sign in.
- Mark as New
- Bookmark
- Subscribe
- Subscribe to RSS Feed
- Report Inappropriate Content
- Unlocking Full-Stack Potential using SAP build code - Part 1 in Technology Blogs by Members
- SAP Business Transformation Journeys: Insights from ASUG Members on the Center of Excellence in Technology Blogs by Members
- Cloud Integration: Manually Sign / Verify XML payload based on XML Signature Standard in Technology Blogs by SAP
- Deep dive into Q4 2023, What’s New in SAP Cloud ALM for Implementation Blog Series in Technology Blogs by SAP
- CAP LLM Plugin – Empowering Developers for rapid Gen AI-CAP App Development in Technology Blogs by SAP
| User | Count |
|---|---|
| 94 | |
| 11 | |
| 10 | |
| 9 | |
| 9 | |
| 7 | |
| 6 | |
| 5 | |
| 4 | |
| 4 |
You must be a registered user to add a comment. If you've already registered, sign in. Otherwise, register and sign in.