- SAP Community
- Products and Technology
- Technology
- Technology Q&A
- Calculation with Results instead of the Single Val...
- Subscribe to RSS Feed
- Mark Question as New
- Mark Question as Read
- Bookmark
- Subscribe
- Printer Friendly Page
- Report Inappropriate Content
Calculation with Results instead of the Single Values
- Subscribe to RSS Feed
- Mark Question as New
- Mark Question as Read
- Bookmark
- Subscribe
- Printer Friendly Page
- Report Inappropriate Content
08-01-2017 1:21 PM - edited 02-04-2024 12:00 AM
Hello together,
i have a problem to which i could not find any solution yet.
We have 3 KPI's that should be evaluated. For that we have a 4th KPI' which is calculated like this: KPI 4 = (KPI1 * 0,3) + (KPI2 * 0,5) + (KPI3 * 0,2).
In the Screenshot it's 1% (KPI1), 2%(KPI2), 3%(KPI3)and 4(KPI4).
For that we have a BEx Query that calculates the average for each KPI.
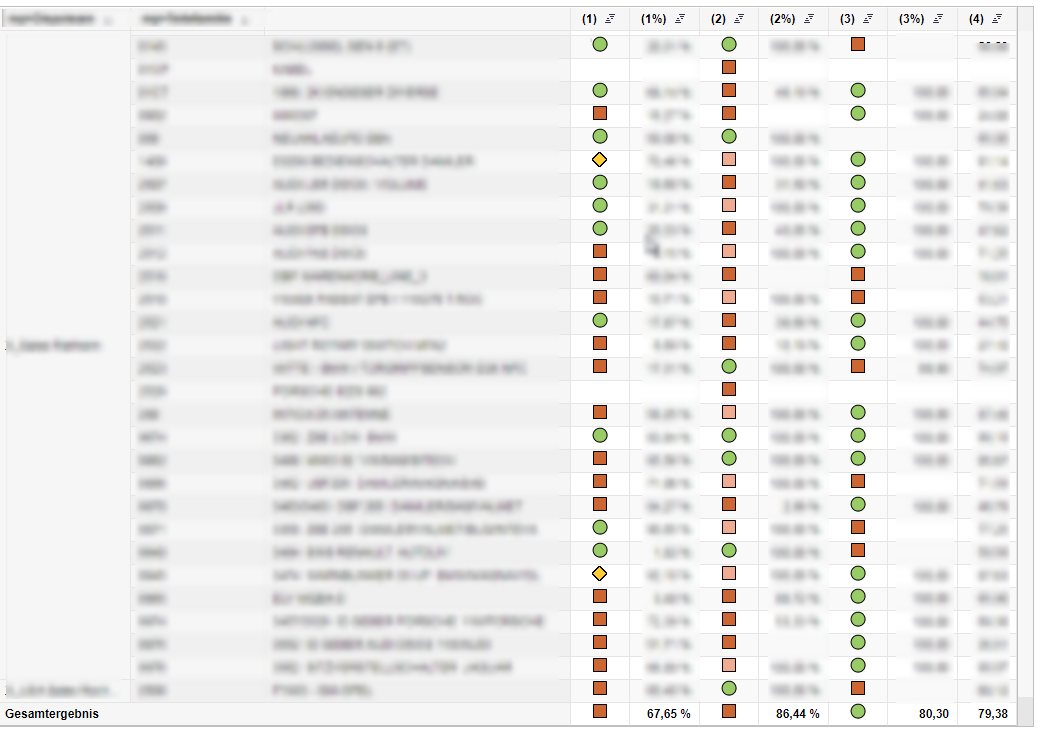
Now the Report calculates the average for each kpi along the columns but instead of calculating like (67,65 * 0,3) + (86,44 * 0,5) + (80,30 * 0,2) (which would be) = 79,575 it calculates for KPI 4 (4) each row and takes the average for that as a total result - giving me the 79,38.
Is there any possibilty (like in the BEx Query Designer or Design Studio) that's allows me to calucalte just the results in my formula?
Thanks in advance,
Marc
- SAP Managed Tags:
- SAP Business ByDesign,
- BW Business Explorer (SAP BEx)
Accepted Solutions (0)
Answers (3)
Answers (3)
- Mark as New
- Bookmark
- Subscribe
- Subscribe to RSS Feed
- Report Inappropriate Content
Hi,
Better if you can post sample values for us to suggest possible solutions.
We have no idea how did you arrive with these values.
(67,65 * 0,3) + (86,44 * 0,5) + (80,30 * 0,2) (which would be) = 79,575 it calculates for KPI 4 (4) each row and takes the average for that as a total result - giving me the 79,38
Anyway, my idea is to use EXCEPTION AGGREGATION based on certain reference characteristics.
Thanks.
Loed
You must be a registered user to add a comment. If you've already registered, sign in. Otherwise, register and sign in.
- Mark as New
- Bookmark
- Subscribe
- Subscribe to RSS Feed
- Report Inappropriate Content
Hi,
unfortunatly it did not work as i have a constant selection in use.
Thanks anyway,
Marc
You must be a registered user to add a comment. If you've already registered, sign in. Otherwise, register and sign in.
- Mark as New
- Bookmark
- Subscribe
- Subscribe to RSS Feed
- Report Inappropriate Content
Hi
you could try to use SUMCT in your formula
grtz
Koen
You must be a registered user to add a comment. If you've already registered, sign in. Otherwise, register and sign in.
- Issue in Inventory Audit Report in Technology Q&A
- How to quantify memory usage of an ABAP instance via Linux commands in Technology Q&A
- Python RAG sample for beginners using SAP HANA Cloud and SAP AI Core in Technology Blogs by SAP
- SAC Measure input control doesn't work in Technology Q&A
- Merge cells in analysis for office? in Technology Q&A
| User | Count |
|---|---|
| 87 | |
| 10 | |
| 10 | |
| 9 | |
| 7 | |
| 6 | |
| 6 | |
| 5 | |
| 4 | |
| 3 |
You must be a registered user to add a comment. If you've already registered, sign in. Otherwise, register and sign in.