- SAP Community
- Products and Technology
- Technology
- Technology Q&A
- SAP Design Studio - Getting the measure and filter...
- Subscribe to RSS Feed
- Mark Question as New
- Mark Question as Read
- Bookmark
- Subscribe
- Printer Friendly Page
- Report Inappropriate Content
SAP Design Studio - Getting the measure and filter with it
- Subscribe to RSS Feed
- Mark Question as New
- Mark Question as Read
- Bookmark
- Subscribe
- Printer Friendly Page
- Report Inappropriate Content
on 06-06-2017 1:37 PM
Hello dear community,
I have a question about how I can get the measure and filter with it.
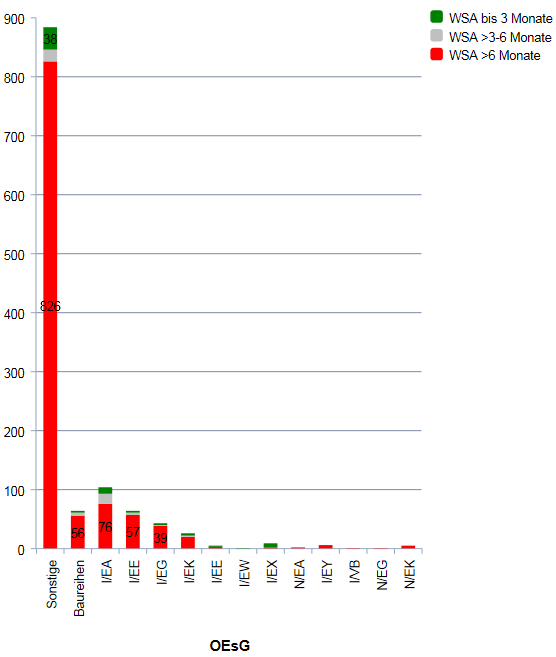
In Design Studio I have a normal bar chart, where I show aggregated values with 3 measures, see below picture.
On the horizontal axis I have values called "OEsG" and on the vertical axis I have the count.
My goal is to get the measure I clicked.
For example: If I click the green bar of the OEsG = 'Sonstige', it should write the selected measure text (in this case it is "WSA bis 3 Monate") into a text box.
My idea was:
TEXT_1.setText( DS_BAR_CHART.getSelectedMember ("OEsG") );
But this just gives me the VALUE of the OEsG, but what I want is to write the name / text of the measure ("WSA bis 3 Monate" into a text box and then use it as a "filter".
- SAP Managed Tags:
- SAP BusinessObjects Design Studio
Accepted Solutions (0)
Answers (2)
Answers (2)
- Mark as New
- Bookmark
- Subscribe
- Subscribe to RSS Feed
- Report Inappropriate Content
Hi Vu,
Your requirement is perfectly clear, in that you want to obtain the selected measure, as is your observation that getSelectedMember() only returns the chart category axis dimension member value. Unfortunately, your requirement is not supported by the standard Stacked InfoChart. There is no possible way to obtain the selected measure.
I would suggest you review the Partner chart extensions for Design Studio in the SAP App Center.
*** UPDATE ***
You can ignore my previous comment. I had an epiphany overnight and realised you can indeed achieve your requirement. You simply need to specify the Measures Dimension in getSelectedMember() instead of the Axis Category Dimension. The steps are as follows:
1. Create a Global Variable called myMeasure;
2. In the "On Select" event script of your chart, apply the following code:
myMeasure = me.getSelectedMember(<Measures Dimension ID>);
TEXT_1.setText(myMeasure.text);
3. To use the selected Measure as a filter, apply the following code in the "On Click" event of the text box:
DS_1.setFilter(<Measures Dimension ID>, myMeasure.internalKey);Regards,
Mustafa.
You must be a registered user to add a comment. If you've already registered, sign in. Otherwise, register and sign in.
- Mark as New
- Bookmark
- Subscribe
- Subscribe to RSS Feed
- Report Inappropriate Content
- Mark as New
- Bookmark
- Subscribe
- Subscribe to RSS Feed
- Report Inappropriate Content
Hi Vu,
You're welcome, glad to hear the suggestion achieved the desired result.
For hiding the measures in a Crosstab, refer to the post: SAP Design Studio – Showing/Hiding Crosstab Columns with Measures with CSS and Scripting.
I am not sure what you mean by "still want to filter this crosstab with the measure value". Can you clarify?
Also, for future reference, as per the SCN Rules of Engagement, if you have a new question, you should post it separately instead of adding it to the existing question, so it is easier for members to find the solution.
Regards,
Mustafa.
- Mark as New
- Bookmark
- Subscribe
- Subscribe to RSS Feed
- Report Inappropriate Content
Hi Mustafa,
thanks for your quick reply again.
I'm sorry for asking an answer here, next time I will do it as you said.
I have read the post you referred to but I still don't understand how to do that.
Can you help me here? I don't understand what to do, can you give me a step-by-step-"tutorial"?
The biggest problem I have here is the editing of the .css-File.
I don't know what to put in that file.
The scripting in Design Studio is no problem for me.
Regards,
Vu
- Mark as New
- Bookmark
- Subscribe
- Subscribe to RSS Feed
- Report Inappropriate Content
Hi - I recommend looking at Karol's blog about formatter function here: https://blogs.sap.com/2015/05/26/design-studio-15-view-on-data-binding-for-text/ - this looks like what you may be looking for - his example is a crosstab
You must be a registered user to add a comment. If you've already registered, sign in. Otherwise, register and sign in.
- Mark as New
- Bookmark
- Subscribe
- Subscribe to RSS Feed
- Report Inappropriate Content
- Mark as New
- Bookmark
- Subscribe
- Subscribe to RSS Feed
- Report Inappropriate Content
Looks like Eshwar was able to do this in this blog - https://blogs.sap.com/2014/11/26/global-scripting-in-design-studio-14/ the third measure.
- Annotation in SEGW in Technology Q&A
- Capture Your Own Workload Statistics in the ABAP Environment in the Cloud in Technology Blogs by SAP
- Empowering Retail Business with a Seamless Data Migration to SAP S/4HANA in Technology Blogs by Members
- Navigation with filters inside a Fiori Elements oData v4 app in Technology Q&A
- Top Picks: Innovations Highlights from SAP Business Technology Platform (Q1/2024) in Technology Blogs by SAP
| User | Count |
|---|---|
| 93 | |
| 11 | |
| 10 | |
| 9 | |
| 9 | |
| 7 | |
| 6 | |
| 5 | |
| 4 | |
| 4 |
You must be a registered user to add a comment. If you've already registered, sign in. Otherwise, register and sign in.