- SAP Community
- Products and Technology
- Technology
- Technology Q&A
- [SAC] Highlight values dynamically in a table colu...
- Subscribe to RSS Feed
- Mark Question as New
- Mark Question as Read
- Bookmark
- Subscribe
- Printer Friendly Page
- Report Inappropriate Content
[SAC] Highlight values dynamically in a table column
- Subscribe to RSS Feed
- Mark Question as New
- Mark Question as Read
- Bookmark
- Subscribe
- Printer Friendly Page
- Report Inappropriate Content
on 05-25-2023 11:46 AM
Hi, need help on this specific problem.

See the above pic for a sample of the data that I have. The table is based on acquired data, there are no model bindings.
What I want to achieve is to highlight the highest and the lowest values for each measure in a column without sorting it or changing the way data is shown. As an example, in column 1(Measure Name 1), the values '0' & '40' should be highlighted, for column 2(Measure Name 2), values '15' & '91' should be highlighted and so on.
- SAP Managed Tags:
- SAP Analytics Cloud
Accepted Solutions (1)
Accepted Solutions (1)
- Mark as New
- Bookmark
- Subscribe
- Subscribe to RSS Feed
- Report Inappropriate Content
akhilgs
Here you go. It seems to be working. I just adjusted the Threshold Measure formula as below.
IF(["BestRunJuice_SampleModel":Gross_Margin]=[#Max GM] ,["BestRunJuice_SampleModel":Gross_Margin]/2 ,IF(["BestRunJuice_SampleModel":Gross_Margin] =[#Min GM],["BestRunJuice_SampleModel":Gross_Margin]/3 ,0 ) )


Hope this helps !!
Please upvote/accept if this helps you.
Nikhil
You must be a registered user to add a comment. If you've already registered, sign in. Otherwise, register and sign in.
- Mark as New
- Bookmark
- Subscribe
- Subscribe to RSS Feed
- Report Inappropriate Content
Answers (4)
Answers (4)
- Mark as New
- Bookmark
- Subscribe
- Subscribe to RSS Feed
- Report Inappropriate Content
Hi subhasmit121, thanks for the reply, this solution won't work out for me as still we are supposed to define the upper and lower bounds and then if any comes in between then SAC will dynamically choose it, but in my case, I won't know what values will come into my measures(all 8 to 9 of them), there is a data load from a BW query that is scheduled which loads data into the model. So that is why I was asking if SAC could check each values in my table column and then highlight the highest and lowest of them all.
You must be a registered user to add a comment. If you've already registered, sign in. Otherwise, register and sign in.
- Mark as New
- Bookmark
- Subscribe
- Subscribe to RSS Feed
- Report Inappropriate Content
Hi Akhil G S,
please go through with this link https://blogs.sap.com/2018/02/16/feature-highlight-dynamic-conditional-formatting-in-sap-analytics-c...
I think it will be helpful for you.
Thank You .
You must be a registered user to add a comment. If you've already registered, sign in. Otherwise, register and sign in.
- Mark as New
- Bookmark
- Subscribe
- Subscribe to RSS Feed
- Report Inappropriate Content
Hi, I saw that blog and tried it as a solution, but it seems to not work out in my case, as I mentioned above I have nearly 8 to 9 measures and all of them are different , in the blog you have only one measure, the sales value and one date dimension which you were using to aggregate on, but I don't have any such dimension to aggregate on.
You must be a registered user to add a comment. If you've already registered, sign in. Otherwise, register and sign in.
- Mark as New
- Bookmark
- Subscribe
- Subscribe to RSS Feed
- Report Inappropriate Content
- Mark as New
- Bookmark
- Subscribe
- Subscribe to RSS Feed
- Report Inappropriate Content
Thanks for the reply, I was able to highlight the highest value, but when I want to highlight the lowest value, there is a problem in the last step where we define the threshold, an error "Threshold exists already. Change or add a filter variable to continue" is shown. See attached screenshot, I have selected the second restricted measure that is used to get a constant value for all members.

I followed the same steps and choose MIN when creating the aggregated measure.
- Mark as New
- Bookmark
- Subscribe
- Subscribe to RSS Feed
- Report Inappropriate Content
akhilgs
Currently only one threshold is supported for a measure. I am not sure if this workaround will work but you can try this create a calculated measure and check Compare measure = IF([Measure]=[Restricted measure max],[Measure],IF([Measure]= [Restricted measure min],[Measure]/2),0). Restricted measure max and min are the one with constant selection. Now use this compare measure for threshold with 2 condition >=100% and >=200%
Hope this helps !!
Nikhil
- Mark as New
- Bookmark
- Subscribe
- Subscribe to RSS Feed
- Report Inappropriate Content
Hi, nikhil_1486, it does not seem to work, I created a calculated measure with the above if condition, in the place of [Measure], I have put the name of the measure for which the min & max values are supposed to be found and as you stated in the case of Restricted Measure Min & Max, the ones with constant selections were used.
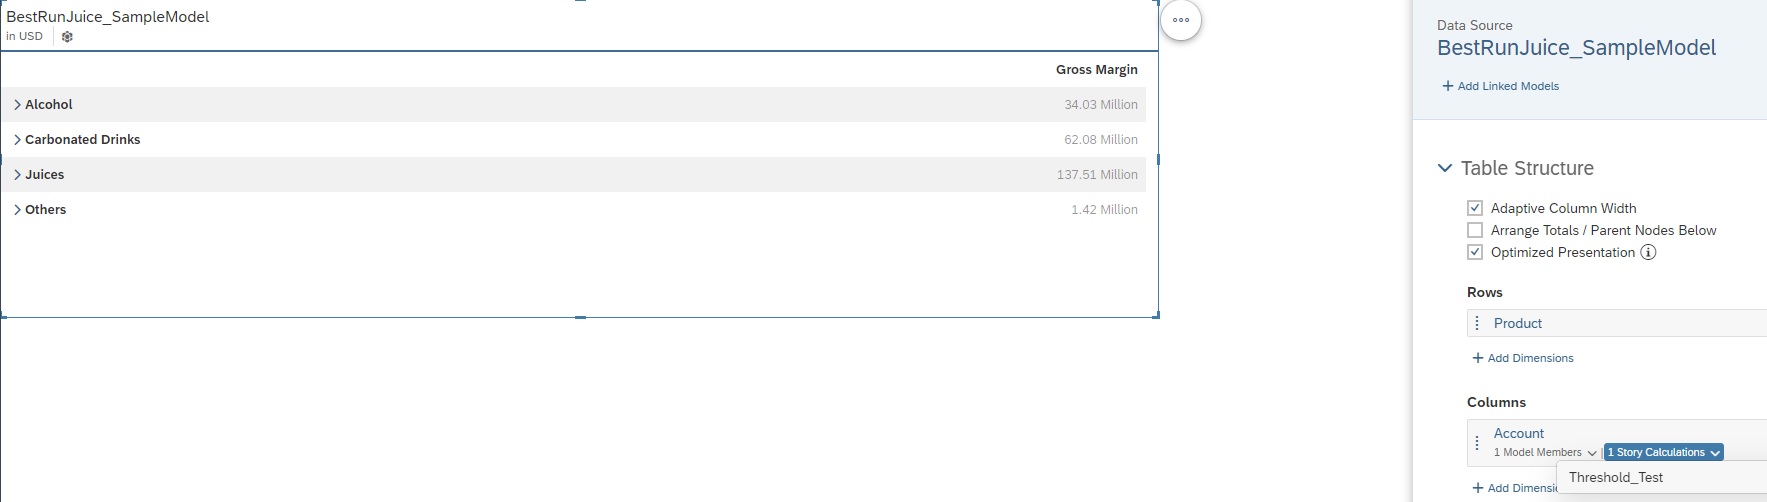
A screenshot of the threshold that was created from the calculated measure.

The if condition used in creating the calculated measure, the model used was the sample model provided within SAC.
Restricted Measure 1 is the Max Contant and Restricted Measure 2 is Min Constant
IF(["BestRunJuice_SampleModel":Gross_Margin]=[#Restricted Measure 1], ["BestRunJuice_SampleModel":Gross_Margin], IF(["BestRunJuice_SampleModel":Gross_Margin]=[#Restricted Measure 2], ["BestRunJuice_SampleModel":Gross_Margin]*2))
- Mark as New
- Bookmark
- Subscribe
- Subscribe to RSS Feed
- Report Inappropriate Content
- Mark as New
- Bookmark
- Subscribe
- Subscribe to RSS Feed
- Report Inappropriate Content
I corrected the if statement, but still nothing, this calculated measure is not even showing in the table even though there are no formatting errors, don't know why that is the case.
Another query regarding your blog, assuming that only one value need to be highlighted at a time, as I stated before, I was able to highlight the highest value, but how do we go about highlighting the lowest value, I created an aggregated measure with MIN, then a restricted measure on the aggregated measure created before for constant values, finally in the threshold step the same as in your blog, but then all values are highlighted instead of the lowest.

Thanks for the help.
- Mark as New
- Bookmark
- Subscribe
- Subscribe to RSS Feed
- Report Inappropriate Content
akhilgs
The below blog should help you achieve it.
Nikhil
You must be a registered user to add a comment. If you've already registered, sign in. Otherwise, register and sign in.
- [XSLT]: Dynamic rows creation and values(in column) based on dynamic nested XML nodes in Technology Q&A
- Set Filter on Search Help of MDG UI in Technology Q&A
- Consolidation Extension for SAP Analytics Cloud – Automated Eliminations and Adjustments (part 1) in Technology Blogs by Members
- CAP LLM Plugin – Empowering Developers for rapid Gen AI-CAP App Development in Technology Blogs by SAP
- Automating Date column in table to show specific dates of last three months in SAC story in Technology Q&A
| User | Count |
|---|---|
| 90 | |
| 10 | |
| 10 | |
| 10 | |
| 7 | |
| 7 | |
| 6 | |
| 5 | |
| 4 | |
| 3 |
You must be a registered user to add a comment. If you've already registered, sign in. Otherwise, register and sign in.