- SAP Community
- Products and Technology
- Technology
- Technology Q&A
- SAPUI5: Formating Viz Frame x-axis and lines
- Subscribe to RSS Feed
- Mark Question as New
- Mark Question as Read
- Bookmark
- Subscribe
- Printer Friendly Page
- Report Inappropriate Content
SAPUI5: Formating Viz Frame x-axis and lines
- Subscribe to RSS Feed
- Mark Question as New
- Mark Question as Read
- Bookmark
- Subscribe
- Printer Friendly Page
- Report Inappropriate Content
on 02-24-2017 8:39 AM
Hello all,
i'm currently trying sth. with HCP and Sensortag.
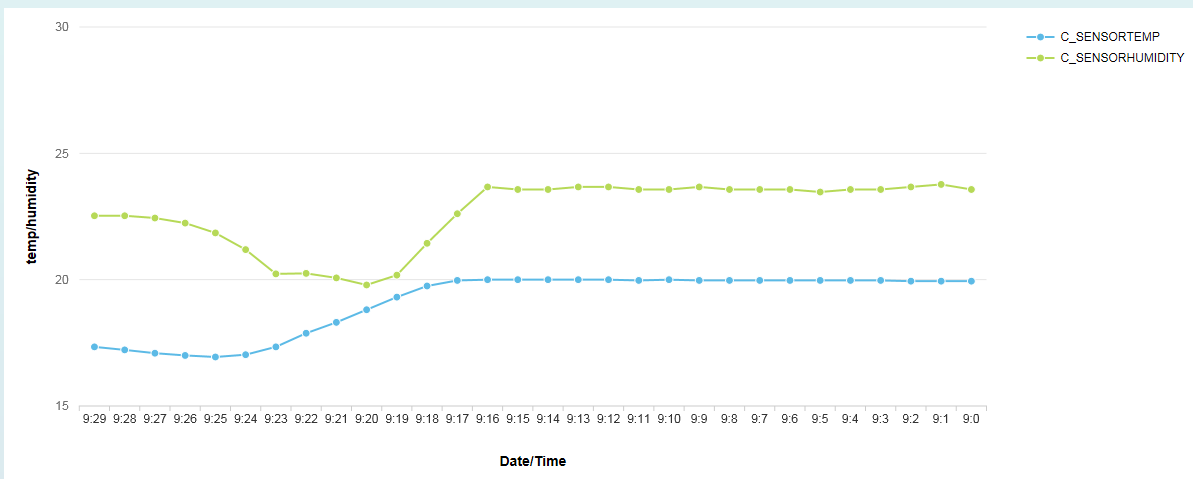
In my example i have some temperatur data (for every 60s) in HCP, which i want to display in a nice diagram. The displaying graph works fine, but i want some better formating.
1) On X-Axis is the hours shown for the last 30 values = last 30 Minutes. Is it possible to change the scale to 6-18 o clock ? so it shows all values from this day, not only the last 30
2) The temperature data exists for several days. Is it possible to display each temperatur line for each day ? so it shows color green for actual day, color blue for the last day, etc.
How many lines are possible to display and how do i edit my code to get this ?
Thanks all,
Andreas
 var vizFrame = new sap.viz.ui5.controls.VizFrame("graph").addStyleClass("sapUiSmallMarginBegin").addStyleClass("sapUiSmallMarginTop");<br> vizFrame.setWidth("1200px");<br>  var oDataset = new sap.viz.ui5.data.FlattenedDataset({<br>  /*  dimensions: [<br>  {<br>   name: "Date",<br>  value: {<br>   path: "G_CREATED",<br>   formatter: function(val){<br>   if (val == null) {<br>   return "string null";<br>   }   <br>   var date = new Date(parseInt(val.substr(6,20)));<br>   var dd = date.getDate();<br>  var mm = date.getMonth()+1; //January is 0!<br>  var yyyy = date.getFullYear();<br>  var hr = date.getHours();<br>  var min = date.getMinutes();<br>  var sec = date.getSeconds();<br>  var fromdate1 = dd+'/'+mm+'/'+yyyy + " " + hr + ":" + min + ":" + sec;<br>   return fromdate1;<br>   }<br>  }<br>  }<br>  ],<br>  */<br>  dimensions: [<br>  {<br>   name: "Hour",<br>  value: {<br>   path: "G_CREATED",<br>   formatter: function(val){<br>   if (val == null) {<br>   return "string null";<br>   }   <br>   var date = new Date(parseInt(val.substr(6,20)));<br>   var dd = date.getDate();<br>  var mm = date.getMonth()+1; //January is 0!<br>  var yyyy = date.getFullYear();<br>  var hr = date.getHours();<br>  var min = date.getMinutes();<br>  var sec = date.getSeconds();<br>  var fromdate1 = dd+'/'+mm+'/'+yyyy + " " + hr + ":" + min + ":" + sec;<br>   return hr + ":" + min;<br>   }<br>  }<br>  }<br>  ],<br>  <br>  measures: [<br>  {<br>   name: "C_SENSORTEMP",<br>  value: "{C_SENSORTEMP}"<br>  },<br>  <br>  {<br>   name: "C_SENSORHUMIDITY",<br>   value: "{C_SENSORHUMIDITY}"<br>  }<br>  <br>  ],<br>  data: {<br>  path: "/items"<br>   <br>  }<br>  });<br>  vizFrame.setDataset(oDataset);<br>  vizFrame.setVizType('line');<br>  <br>  vizFrame.setVizProperties({<br>  plotArea: {<br>   colorPalette :  ["#5cbae6", "#b6d957", "#fac364"]<br>  },<br>  categoryAxis: {<br>   title: {<br>   text: "Date/Time"<br>   }<br>  },<br>  valueAxis: {<br>   title: {<br>   text: "temp/humidity"<br>   }<br>  },<br>  title: {<br>   visible:false<br>  },<br>  xAxis : {
scale: {<br>  fixedRange : true,<br>  minValue : "6:00",<br>  maxValue : "18:00"<br>  }

  },<br>  yAxis : {
 scale: {<br>  fixedRange : true,<br>  minValue : "15",<br>  maxValue : "30"<br>  }
  }<br> });<br> <br> var feedValueAxis = new sap.viz.ui5.controls.common.feeds.FeedItem({<br>  'uid': "valueAxis",<br>  'type': "Measure",<br>  'values': ["C_SENSORTEMP", "C_SENSORHUMIDITY"]<br>  }), <br>  feedCategoryAxis = new sap.viz.ui5.controls.common.feeds.FeedItem({<br>  'uid': "categoryAxis",<br>  'type': "Dimension",<br>  'values': ["Hour"]<br>  });
- SAP Managed Tags:
- SAPUI5
Accepted Solutions (0)
Answers (1)
Answers (1)
- Mark as New
- Bookmark
- Subscribe
- Subscribe to RSS Feed
- Report Inappropriate Content
You could try timeseries_line chart. Here is the demo https://sapui5.hana.ondemand.com/#/sample/sap.viz.sample.TimeConfig/preview .
You must be a registered user to add a comment. If you've already registered, sign in. Otherwise, register and sign in.
- Instruction of implement-test-deploy flow for SAPUI5 plus CAP integrated with another services in Technology Blogs by Members
- Rearrange cells in a sap.m.ColumnListItem in Technology Q&A
- Fiori launchpad integrated GPT assistant: UI in Technology Blogs by Members
- SAC - the format of the table in the Excel file exported from SAC (dimensions is not in first line) in Technology Q&A
- Error during AggregationBinding for sap.suite.ui.commons.networkgraph.Node in Technology Q&A
| User | Count |
|---|---|
| 93 | |
| 10 | |
| 10 | |
| 9 | |
| 9 | |
| 7 | |
| 6 | |
| 5 | |
| 5 | |
| 4 |
You must be a registered user to add a comment. If you've already registered, sign in. Otherwise, register and sign in.