- SAP Community
- Products and Technology
- Technology
- Technology Q&A
- R-Visualizations problem in SAC - library formatta...
- Subscribe to RSS Feed
- Mark Question as New
- Mark Question as Read
- Bookmark
- Subscribe
- Printer Friendly Page
- Report Inappropriate Content
R-Visualizations problem in SAC - library formattable
- Subscribe to RSS Feed
- Mark Question as New
- Mark Question as Read
- Bookmark
- Subscribe
- Printer Friendly Page
- Report Inappropriate Content
on 01-14-2022 12:36 PM
Hello!
I am trying to reproduce the coding example of https://www.magesblog.com/post/2016-01-19-formatting-table-output-in-r/.
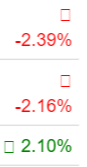
The visualization problem which occurs when running the code is, that the formatting of the "arrow-up" and "arrow-down" icons isn't working. Basically the R-Interface of SAP Analytics Cloud should support the library formattable but for some reasons the visualization of the icons is not supported.
Do you have any suggestions?
See visualization and code below:
library(formattable)
DF <- data.frame(Ticker=c("", "", "", "IBM", "AAPL", "MSFT"),
                 Name=c("Dow Jones", "S&P 500", "Technology",
                        "IBM", "Apple", "Microsoft"),
                 Value=accounting(c(15988.08, 1880.33, NA,
                                    130.00, 97.05, 50.99)),
                 Change=percent(c(-0.0239, -0.0216, 0.021,
                                  -0.0219, -0.0248, -0.0399)))
DF

formattable(DF, list(
  Name=formatter(
    "span",
    style = x ~ ifelse(x == "Technology",
                       style(font.weight = "bold"), NA)),
  Value = color_tile("white", "orange"),
  Change = formatter(
    "span",
    style = x ~ style(color = ifelse(x < 0 , "red", "green")),
    x ~ icontext(ifelse(x < 0, "arrow-down", "arrow-up"), x)))
)
- SAP Managed Tags:
- SAP Analytics Cloud
Accepted Solutions (1)
Accepted Solutions (1)
- Mark as New
- Bookmark
- Subscribe
- Subscribe to RSS Feed
- Report Inappropriate Content
Hi Korab,
The first thing you should check is whether the library used in the code is supported by SAP Analytics Cloud (R Packages for SAP Analytics Cloud). Only a subset of libraries is included in the R-server environment and I don't see formattable on the list. An alternative is to look for another, supported, library to write your code. Another option is to set up your own R-server (which must be internet-facing).
More information can be found here: 2547708 - How to install additional packages on the R-server in SAP Analytics Cloud.
Kind regards,
Martijn van Foeken | Interdobs
You must be a registered user to add a comment. If you've already registered, sign in. Otherwise, register and sign in.
- Mark as New
- Bookmark
- Subscribe
- Subscribe to RSS Feed
- Report Inappropriate Content
My bad! The library is not supported by SAC! I was running "INSTALLED PACKAGES" in the console and the "formattable" was listed there. That's why I thought it is already supported. Thanks for the reminder. I have to find an alternative displaying the arrows in the table.
Answers (1)
Answers (1)
- Mark as New
- Bookmark
- Subscribe
- Subscribe to RSS Feed
- Report Inappropriate Content
Are you using SAP-provided R server runtime environment? If so, then I do not see `formattable` at the list of pre-installed packages: https://blogs.sap.com/2020/03/18/r-packages-for-sap-analytics-cloud/
Regards,
-Vitaliy
You must be a registered user to add a comment. If you've already registered, sign in. Otherwise, register and sign in.
- Mark as New
- Bookmark
- Subscribe
- Subscribe to RSS Feed
- Report Inappropriate Content
| User | Count |
|---|---|
| 86 | |
| 10 | |
| 10 | |
| 9 | |
| 6 | |
| 6 | |
| 6 | |
| 5 | |
| 4 | |
| 3 |
You must be a registered user to add a comment. If you've already registered, sign in. Otherwise, register and sign in.