- SAP Community
- Products and Technology
- Technology
- Technology Q&A
- Webi Table Creating Group from Measure
- Subscribe to RSS Feed
- Mark Question as New
- Mark Question as Read
- Bookmark
- Subscribe
- Printer Friendly Page
- Report Inappropriate Content
Webi Table Creating Group from Measure
- Subscribe to RSS Feed
- Mark Question as New
- Mark Question as Read
- Bookmark
- Subscribe
- Printer Friendly Page
- Report Inappropriate Content
on 09-28-2020 8:17 PM
Hello,
I am trying to create groupings in a Webi table that are based off of a Sum measure.
I have a list of invoices with associated payments. Some invoices have multiple payments and can span over multiple years. I want to sum the total payments per year for an invoice and then group those results into 'Total Ranges'
Total Ranges:
0-1000
1000-2000
and so on.
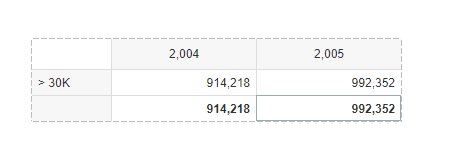
My final table I want to just see a count of invoices for each year that fall into each of these ranges
Example:
Total payments for invoice 20040006 for 2004 = $1348 so that falls into the 1000-2000 range
Total payments for invoice 20040007 for 2004 = $172 so that falls into the 0-1000 range
My final table would look like this

The Payment field is a Sum measure from the universe.
I have created a dimension variable to assign the group label based on the total payments


I created a vertical table with a group on the PaymentRanges dimension variable
If i keep the report filtered to 1 year, it displays the correct values for that year. I dont want to create another break on the Year field because it's too messy
Id like for it to be a cross tab report but when i try to create that, the PaymentRange break down is lost as everything is rolled up for the entire year.
Any thoughts on how to accomplish this? I think I need to assign some context to the measure variable used in the cross tab but I'm not sure how.
If I need to offer any additional information, please let me know.
- SAP Managed Tags:
- SAP BusinessObjects - Web Intelligence (WebI)
Accepted Solutions (0)
Answers (0)
- Business Partner customizing for Automotive Industry in Technology Blogs by Members
- Extend Your Crystal Reports Solutions in the DHTML Viewer With a Free Function Library in Technology Blogs by Members
- Composite Data Source Configuration in Optimized Story Experience in Technology Blogs by SAP
- Onboarding Users in SAP Quality Issue Resolution in Technology Blogs by SAP
- Up Net Working Capital, Up Inventory and Down Efficiency. What to do? in Technology Blogs by SAP
| User | Count |
|---|---|
| 84 | |
| 10 | |
| 10 | |
| 9 | |
| 7 | |
| 7 | |
| 6 | |
| 5 | |
| 4 | |
| 4 |
You must be a registered user to add a comment. If you've already registered, sign in. Otherwise, register and sign in.