Srinath,
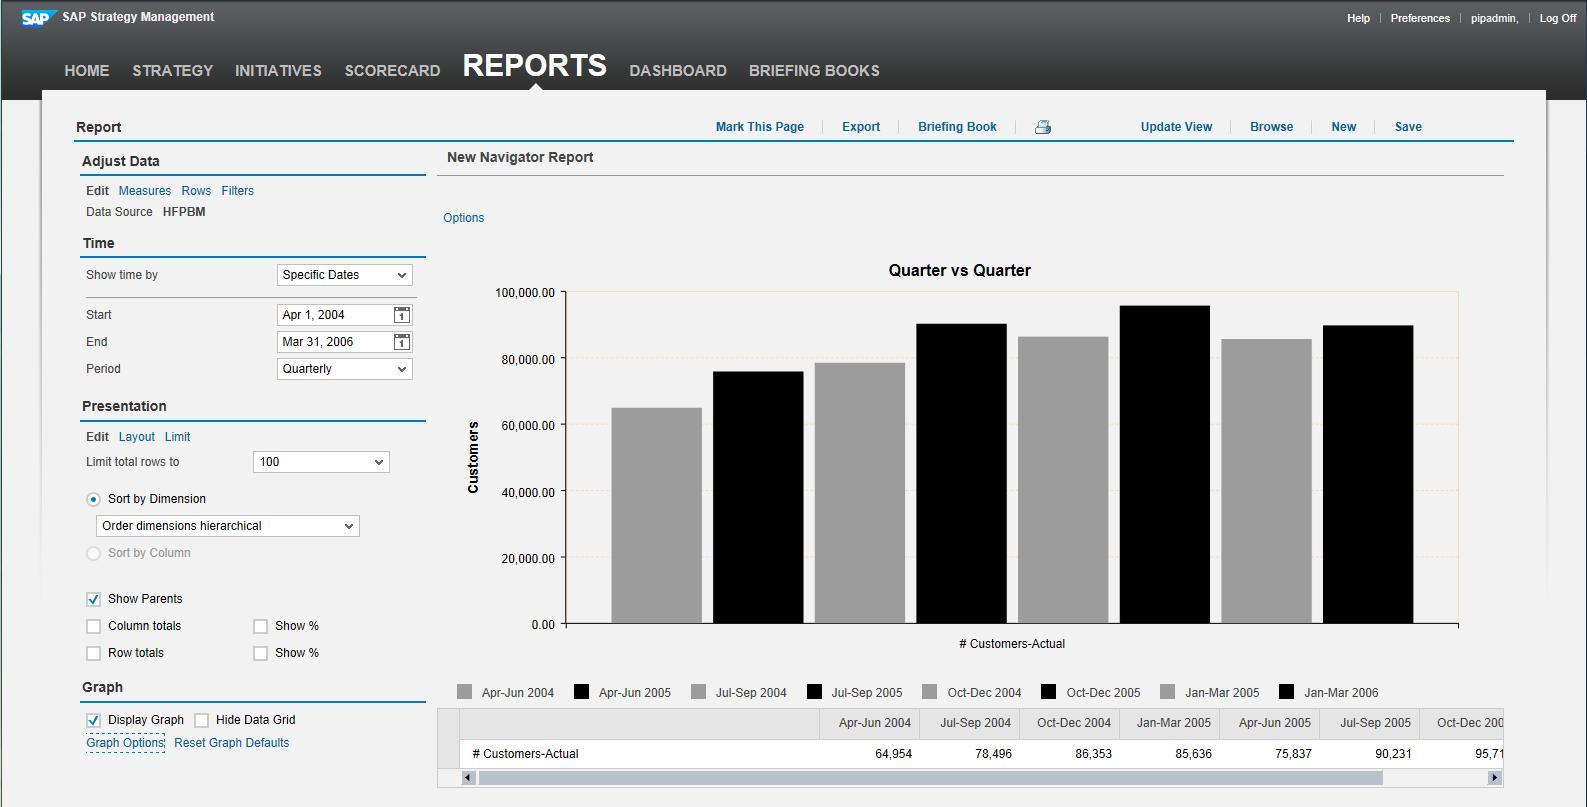
Yes you can put the quarets side by side so you can compare Q! this year with Q1 last year.
The trick is to use the select by columns option within reports and then to rearrange the bars so that the Q1 for this year and last year are side by side.
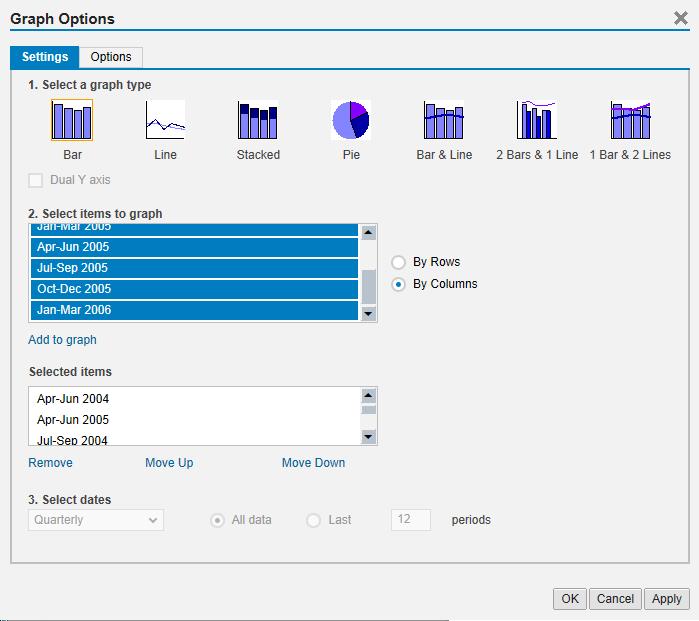
Then you can add a title and set the colour scheme so that last year has one colour and this year has a different colour.

The result is as follows:
Regards
Colin
You must be a registered user to add a comment. If you've already registered, sign in. Otherwise, register and sign in.